Jun-2026
Sales
Trend
6-Month
Product Count
SKUs
Avg Price
YoY Sales Change
YoY Price Change
Market Insights Snapshot
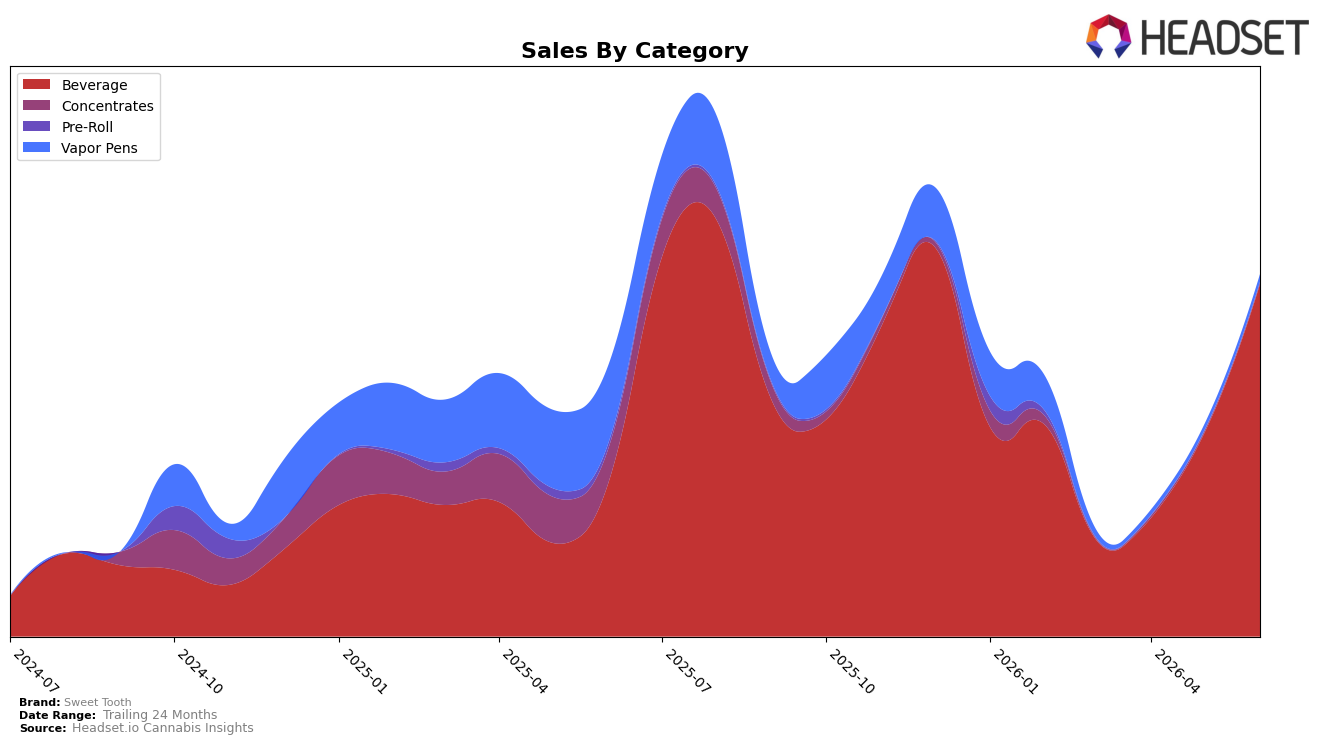
In June 2026, Beverage carried 97.55% share with 130.42% year-over-year growth and 72.84% month-over-month, while Vapor Pens slipped to 2.06% share after a -90.43% year-over-year but rebounded 29.91% month-over-month. Concentrates held 0.37% share with -96.12% year-over-year and -10.10% month-over-month, and Pre-Roll shrank to 0.02% share with -98.29% year-over-year and -80.42% month-over-month. The average price fell 4.25% year-over-year to $7.70 while Beverage’s average price sat at $7.67, and category rank in Beverage in British Columbia was 7. The pattern implies Sweet Tooth has consolidated into Beverage leadership within its own mix, using lower prices amid rapid Beverage volume gains to offset steep declines in peripheral categories.
The surge in Beverage share from outsized 130.42% year-over-year and 72.84% month-over-month growth, alongside a -4.25% brand-wide price change, indicates a price-to-velocity trade that elevates Sweet Tooth’s visibility in a value-leaning Beverage segment while deprioritizing Vapor Pens and Concentrates after -90.43% and -96.12% year-over-year drops, respectively. Sitting at rank 7 in British Columbia Beverage with a 97.55% mix concentration suggests a single-category posture: the brand is optimizing for Beverage depth over breadth, which can lift short-term share but increases exposure to Beverage-specific demand swings and narrows future cross-category trial.
Competitive Landscape
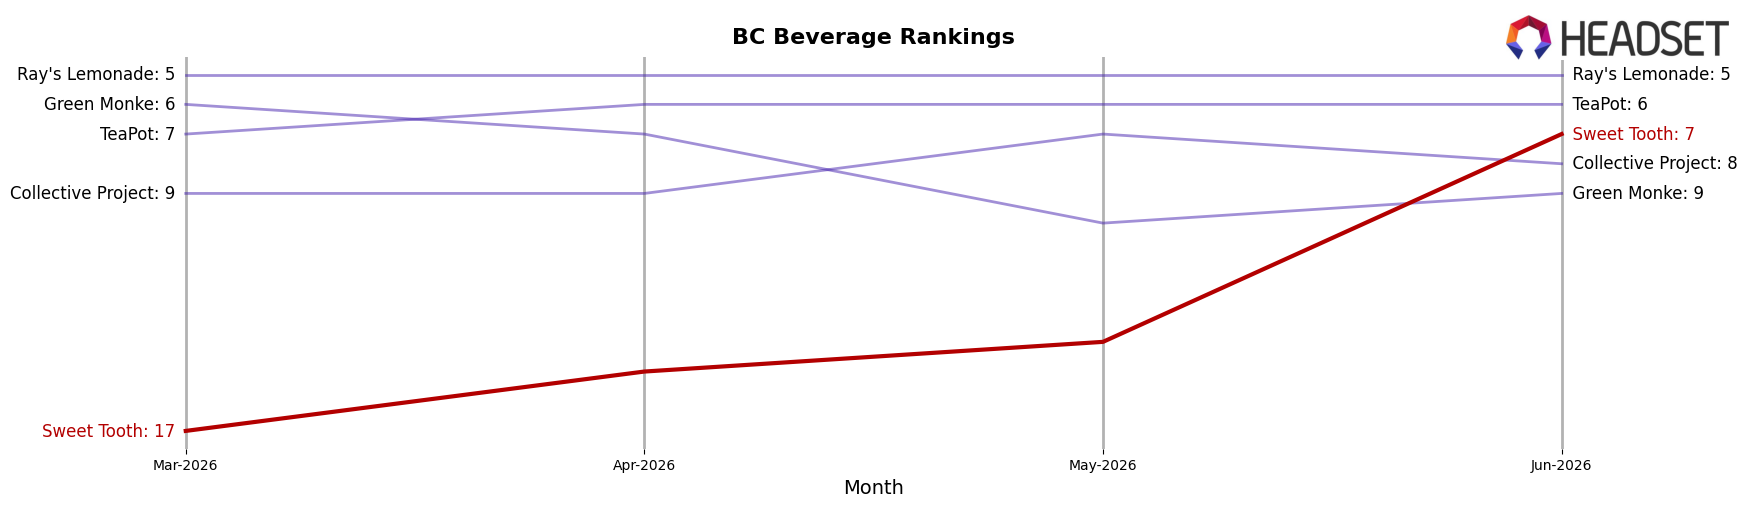
Sweet Tooth sits at #7 in BC Beverage in June 2026, up 10 ranks from #17 year over year, and up 10 ranks from #17 in March 2026; its best historical position remains #6 reached in October 2025. Against this backdrop, Bubble Kush rose from #2 to #1 while growing sales 17.48% year over year, and Mollo climbed from #4 to #2 with 68.93% YoY growth, whereas XMG held at #3 with a -0.58% YoY sales change. The pattern implies Sweet Tooth’s double-digit rank gain is a recovery into the competitive tier just below its October 2025 peak, but sustained share requires converting the recent climb from #17 to #7 into consistent top-6 penetration while faster-rising neighbors consolidate above it.
Notable Products
CBD/CBG 1:1 Grapefruit Zero Sparkling Beverage (25mg CBG, 25mg CBD) posted the standout move in June 2026 with a 1,408.98% month-over-month surge to rank 3, while Spiced Apple Soda (10mg THC, 355ml) dropped 68.21% to rank 7. Raspberry Cream Soda Zero Live Rosin Beverage (10mg THC, 355ml) rose 56.95% to rank 1, and Zero - Root Beer Float Sparkling Beverage (10mg THC, 355ml) climbed 26.78% at rank 2, indicating zero-sugar formats are anchoring the top tier. Five of the top ten are Beverage SKUs, including a 26.64% decline for Fizzy Peach Live Rosin Sparkling Beverage (10mg THC, 355ml) at rank 5, which contrasts with a 71.97% rise for Peaches & Dream Distillate Cartridge (1g) at rank 9, implying diversification is pulling in both functional CBD/CBG buyers and value-seeking vapor shoppers. The pattern points to Sweet Tooth reallocating momentum toward zero-sugar and functional beverages while using a limited vapor presence to hedge flavor volatility in the core drink lineup.
Top Selling Cannabis Brands
Data for this report comes from real-time sales reporting by participating cannabis retailers via their point-of-sale systems, which are linked up with Headset’s business intelligence software. Headset’s data is very reliable, as it comes digitally direct from our partner retailers. However, the potential does exist for misreporting in the instance of duplicates, incorrectly classified products, inaccurate entry of products into point-of-sale systems, or even simple human error at the point of purchase. Thus, there is a slight margin of error to consider. Brands listed on this page are ranked in the top twenty within the market and product category by total retail sales volume.

