.svg)

Aug-2026
Sales
Trend
6-Month
Product Count
SKUs
Avg Price
YoY Sales Change
YoY Price Change


Where to Buy
Swell Edibles is stocked at 142 licensed dispensaries across Washington and New Jersey, 125 of them in Washington, with the deepest coverage in Seattle, Tacoma, Spokane, Everett, and Vancouver. Search by ZIP code or city below to find the closest one, or filter by product type if you are after a specific format.
Market Insights Snapshot
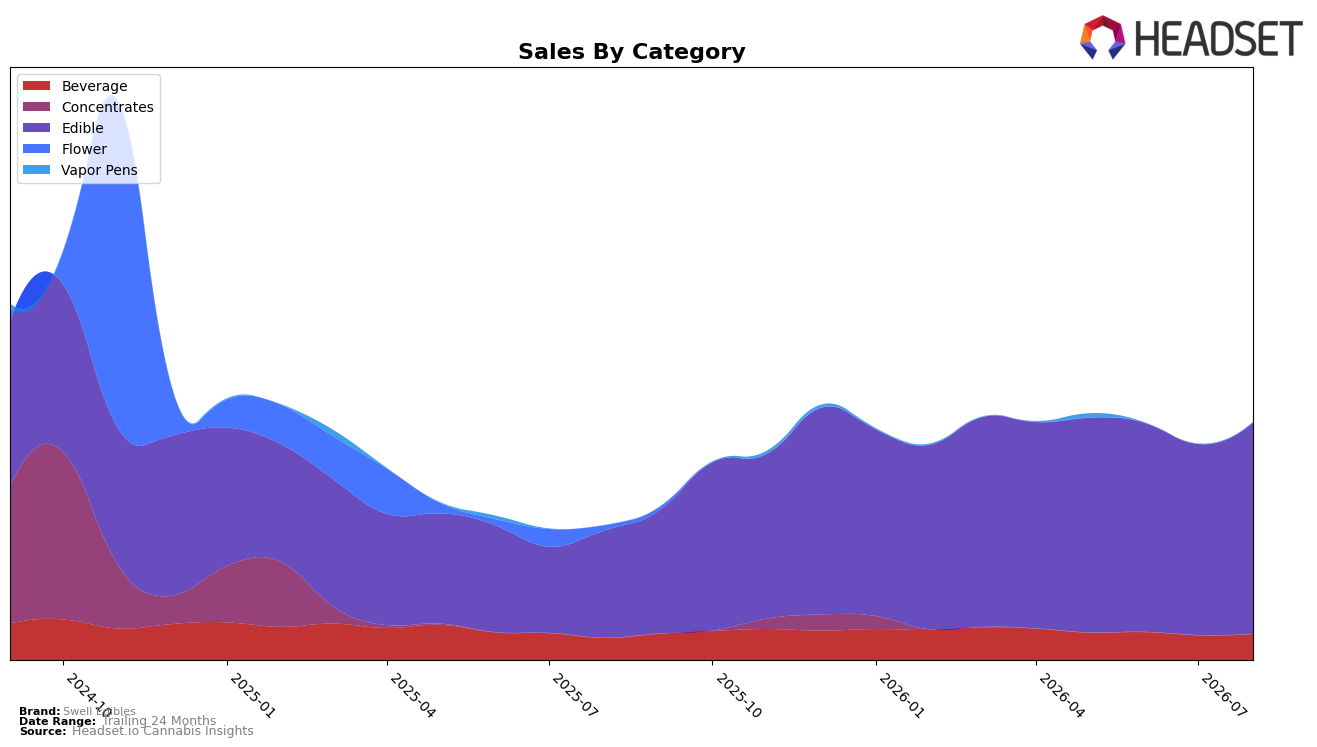
Swell Edibles concentrated 88.93% of August 2026 sales in Edible, up 97.92% year over year and 10.58% month over month, while Beverage held 11.07% with 18.54% YoY and 5.82% MoM growth; the overall brand rose 77.07% YoY with an average price down 7.26%. Within Edible, average price of $9.67 sat above the brand’s $9.16 blended average, whereas Beverage averaged $6.45, indicating mix-driven price pressure alongside volume expansion. The pattern implies the brand is leaning into Edible-led scale to gain share faster than Beverage, using relative price compression to accelerate unit velocity.
In Washington Edible, Swell Edibles sat at rank 23 in August 2026, anchored by an Edible share of 88.93% and dual growth vectors of 97.92% YoY and 10.58% MoM versus Beverage’s 11.07% share with 18.54% YoY and 5.82% MoM. With a 24‑month sales change of -49.20% alongside current 77.07% YoY growth, the brand is rebuilding via Edibles rather than broadening into Beverage, suggesting a positioning bet on depth over breadth to climb from rank 23 amid tightening average prices.
Competitive Landscape
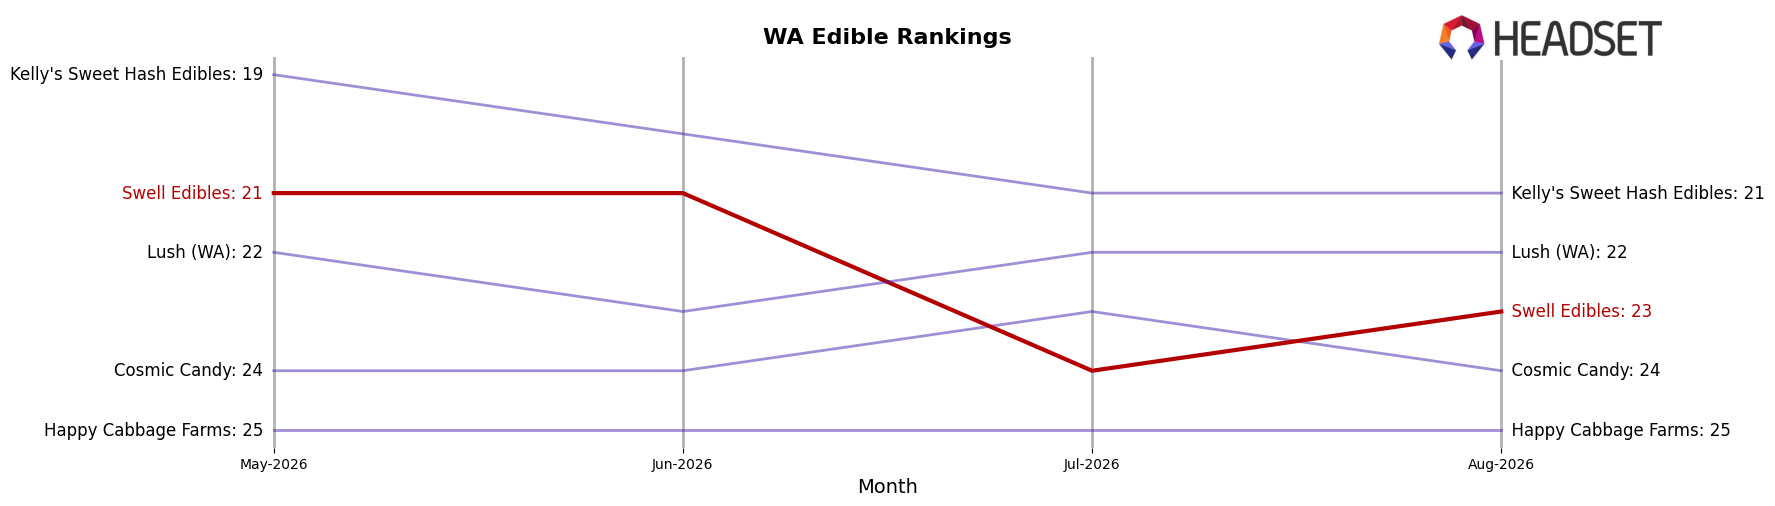
Swell Edibles sits at rank 23 in WA Edible in August 2026 with a 0-place YoY rank change from August 2025, while its three-month trend slipped from rank 21 to 23 and remains below its peak at rank 19 from August 2024; in contrast, Wyld held rank 1 with a 0-place YoY change while posting a 5.1% YoY sales increase, and Green Revolution stayed at rank 2 with a 0-place YoY change despite a -7.0% YoY sales decline. This combination—flat YoY rank at 23 alongside a two-position slide from the recent three-month view and distance from the historical peak—implies Swell Edibles is locked in a stable-but-stalled tier where incremental share shifts at the top constrain upward mobility absent a clear catalyst.
Notable Products
Indica Paradise Punch Fruit Burst Chews 10-Pack (100mg) posted the steepest move in August 2026 with a -30.0% MoM drop while sliding to rank 7, as Sativa Chillin Cherry Lime Fruit Burst Chews 10-Pack (100mg) also fell -28.2% at rank 9, signaling a mid-pack shakeout rather than a top-heavy issue. At the top, Indica Watermelon Wipeout Fruit Burst Chews 10-Pack (100mg) rose +23.3% to hold rank 1 and Sativa Hang Ten Huckleberry Fruit Burst Chews 10-Pack (100mg) climbed +21.1% at rank 3, even as Sativa Watermelon Wipeout Fruit Burst Chews 10-Pack (100mg) declined -17.8% at rank 10, pointing to flavor-specific momentum over blanket Sativa or Indica effects. Eight of the top ten are Fruit Burst Chews in the Edible category, and within that family Sativa variants split between growth (+21.1%) and contraction (-28.2%, -11.2%, -17.8%), indicating portfolio concentration with uneven velocity by flavor rather than by cannabinoid type. The mix implies Swell Edibles is leaning into a narrow chew format where winner flavors can scale quickly while laggards risk rapid share loss, so SKU-level flavor pruning and targeted pushes on the two accelerating leaders could rebalance revenue concentration despite a $8.2K ceiling at rank 1.
Top Selling Cannabis Brands






Data for this report comes from real-time sales reporting by participating cannabis retailers via their point-of-sale systems, which are linked up with Headset’s business intelligence software. Headset’s data is very reliable, as it comes digitally direct from our partner retailers. However, the potential does exist for misreporting in the instance of duplicates, incorrectly classified products, inaccurate entry of products into point-of-sale systems, or even simple human error at the point of purchase. Thus, there is a slight margin of error to consider. Brands listed on this page are ranked in the top twenty within the market and product category by total retail sales volume.

