Jun-2026
Sales
Trend
6-Month
Product Count
SKUs
Avg Price
YoY Sales Change
YoY Price Change
Market Insights Snapshot
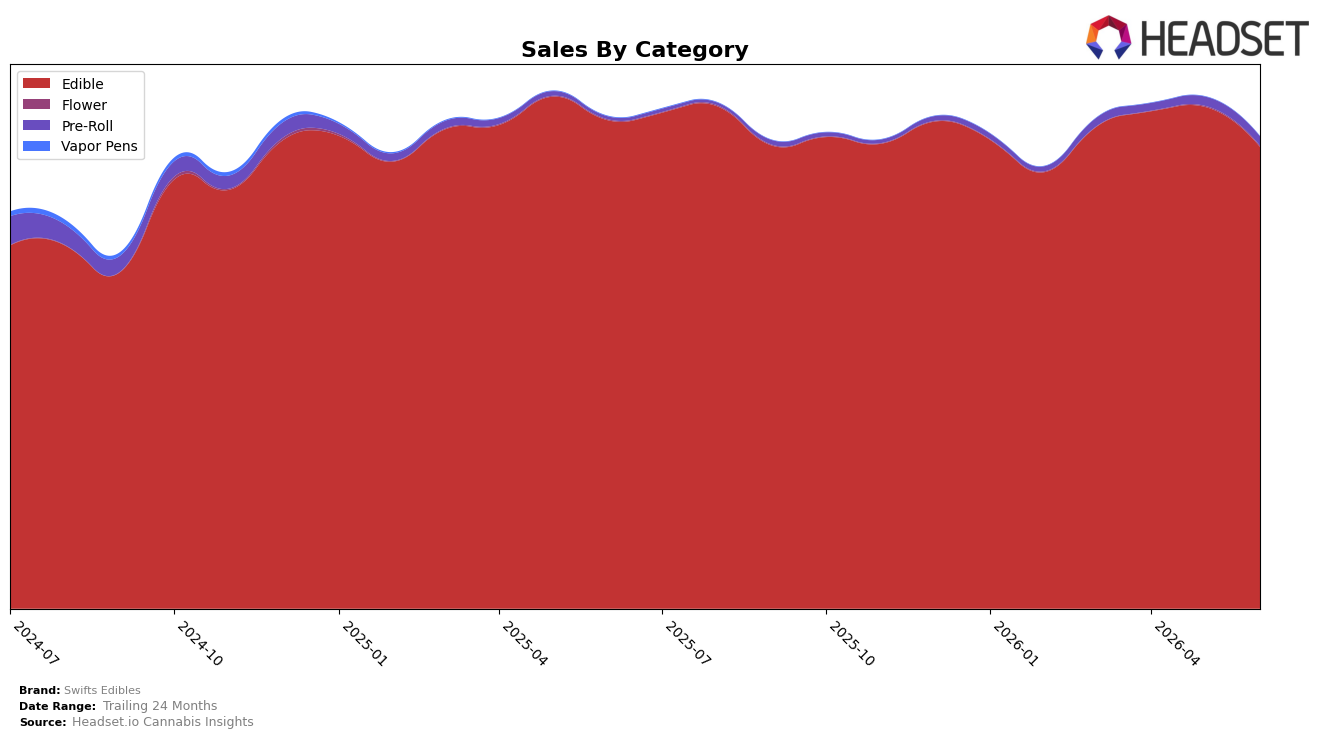
In June 2026, Swifts Edibles concentrated 97.95% of sales in Edible, where year-over-year declined 5.45% and month-over-month slipped 7.99%, while the smaller Pre-Roll line rose 262.67% YoY and 1.86% MoM to 1.90% share. Flower, though only 0.15% share, advanced 44.08% YoY and 23.60% MoM alongside a 4.85% YoY drop in average brand price to $13.98, indicating that category breadth is expanding at the margins even as the core Edible volume contracts. With Edible anchoring the mix and Pre-Roll and Flower accelerating from a low base, the pattern implies the brand is leaning toward a multi-format hedge to offset core-category softness.
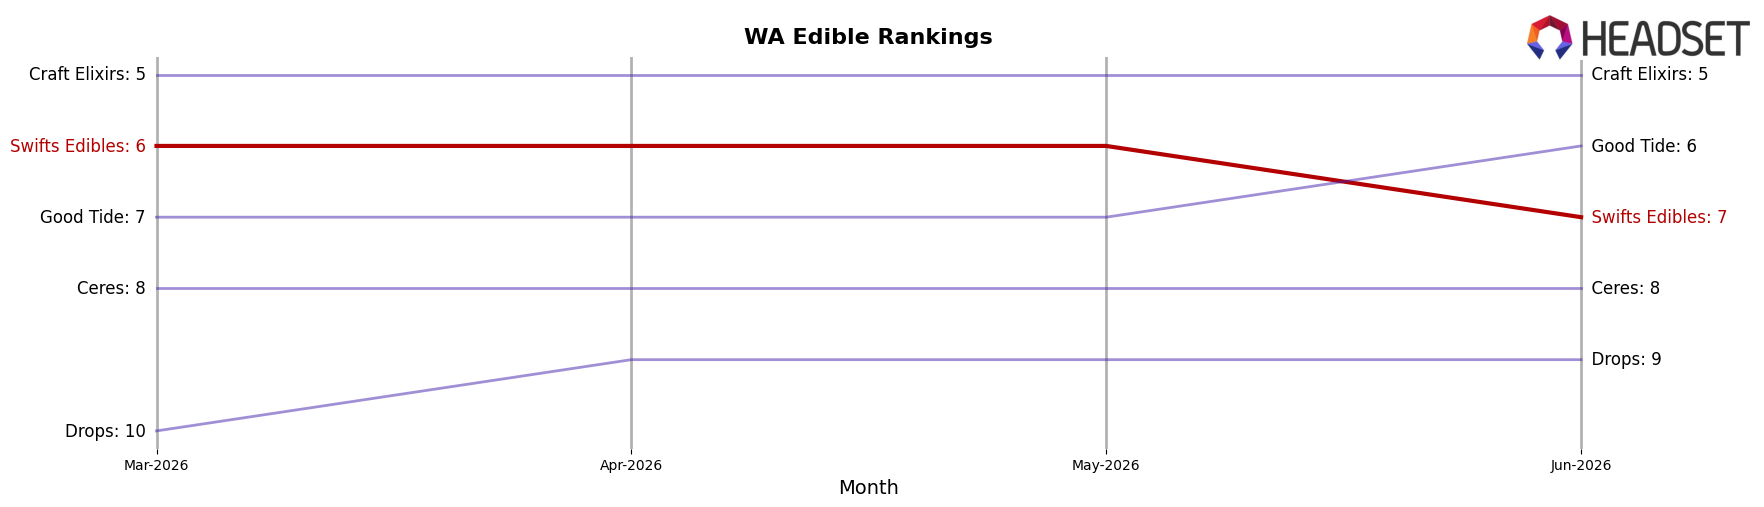
Given a 7th-place rank in Edible within Washington and a -4.08% YoY brand sales change alongside a 17.11% 24-month gain, the recent month’s -7.99% MoM in Edible versus +1.86% MoM in Pre-Roll signals near-term share risk in the core and incremental upside from adjacent formats. The 97.95% reliance on Edible coupled with Pre-Roll’s 262.67% YoY and Flower’s 44.08% YoY growth suggests repositioning headroom: sustaining rank will likely depend on stabilizing the Edible base while selectively scaling the faster-growing satellite categories.
Competitive Landscape
Swifts Edibles sits at rank #7 in WA Edible for June 2026, slipping 1 position from #6 year over year, and it also moved down 1 spot from its peak rank of #6 reached in May 2026, while top competitor Wyld held #1 with a 7.3% year-over-year sales increase and Green Revolution stayed at #2 with a 17.5% lift; compared with Hot Sugar at #3 despite a 1.8% sales decline and Craft Elixirs holding #5 with a 1.2% drop, the 1-rank YoY slide for Swifts Edibles suggests incremental share loss concentrated after its May 2026 peak rather than broad category weakness, implying the brand must convert mid-tier volatility into consistent gains to re-enter the top 5.
Notable Products
CBD/THC/CBG/CBN Huckleberry Max Gummies 10-Pack (300mg CBD, 100mg THC, 50mg CBG, 50mg CBN) posted the steepest decline at -12.11% and slid to rank 2, while Indica Peanut Butter Dark Chocolate Cups 10-Pack (100mg) fell -12.80% to rank 3. The category was broadly down with the top SKU, CBD/CBN/CBG/THC Max Peanut Butter Milk Chocolate Cups 10-Pack (300mg CBD, 50mg CBN, 50mg CBG, 100mg THC), off -9.08% at rank 1, and Sativa Peanut Butter Milk Rosin Chocolate 10-Pack (100mg) dropping -17.36% at rank 9. With four of the top ten anchored in Peanut Butter Chocolate cups and only one material MoM gainer at +2.09% in Sativa Peanut Butter Dark Chocolate Cups 10-Pack (100mg), the mix implies reliance on legacy cup formats that are saturating rather than expanding in June 2026.
Top Selling Cannabis Brands
Data for this report comes from real-time sales reporting by participating cannabis retailers via their point-of-sale systems, which are linked up with Headset’s business intelligence software. Headset’s data is very reliable, as it comes digitally direct from our partner retailers. However, the potential does exist for misreporting in the instance of duplicates, incorrectly classified products, inaccurate entry of products into point-of-sale systems, or even simple human error at the point of purchase. Thus, there is a slight margin of error to consider. Brands listed on this page are ranked in the top twenty within the market and product category by total retail sales volume.

