Market Insights Snapshot
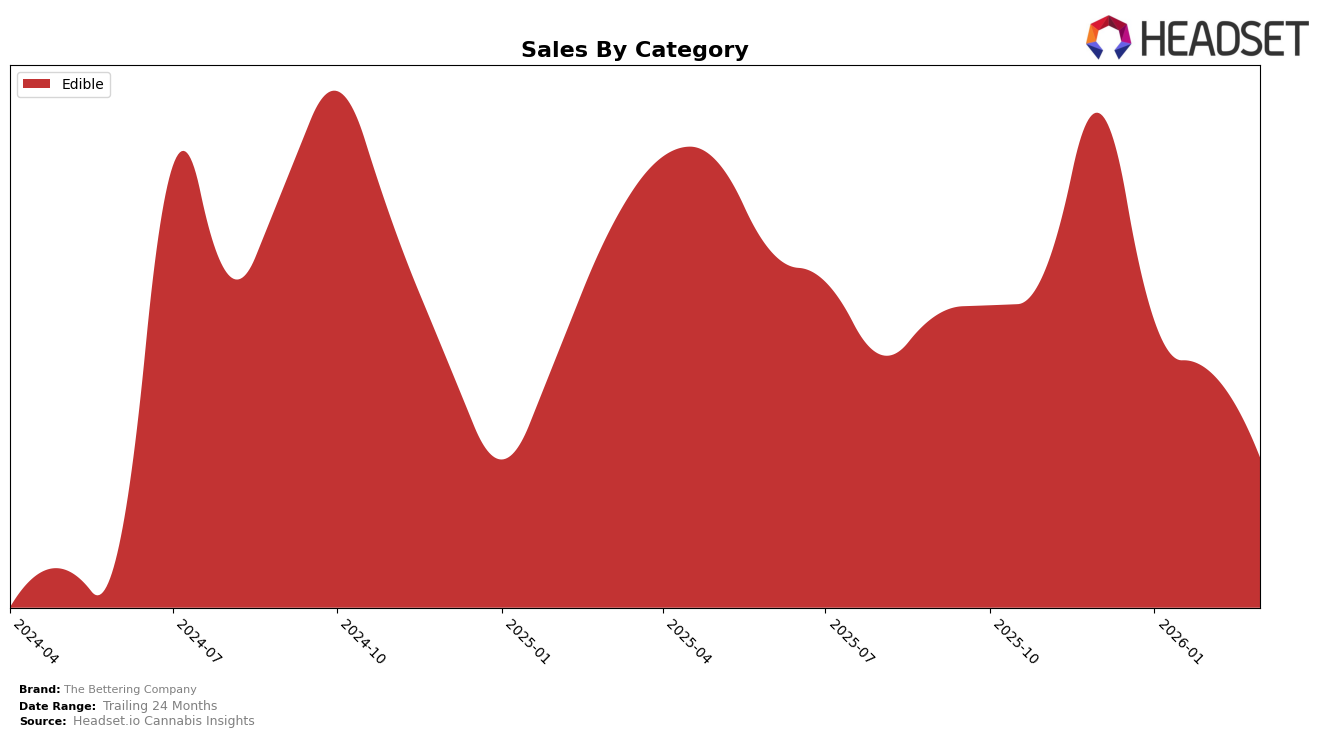
The Bettering Company has shown a varied performance across different states and product categories, with notable movements in rankings. In the New York market, the brand's presence in the Edible category has experienced a downward trend over the months from December 2025 to March 2026. Starting at a rank of 23 in December, the brand slipped to rank 29 by March, indicating a decline in market positioning. This drop in rank suggests increased competition or a shift in consumer preferences within the category. The brand's sales figures in New York also reflect this trend, with a noticeable decrease from December to March, which could be attributed to various market dynamics or internal brand strategies.
Interestingly, the absence of The Bettering Company from the top 30 brands in other states and categories may point to challenges in expanding their market footprint or a strategic focus on specific regions and product lines. The lack of rankings in additional states could be seen as a missed opportunity for growth or a result of targeted marketing efforts that have not yet yielded significant results. The data suggests that while The Bettering Company holds a spot in the New York Edible category, there is room for improvement and potential for expansion into other markets and product categories, provided they adapt to local consumer demands and competitive pressures.
Competitive Landscape
In the competitive landscape of the Edible category in New York, The Bettering Company has experienced a notable decline in its market position over the past few months. Starting from a rank of 23 in December 2025, the brand has slipped to 29 by March 2026. This downward trend is concerning, especially when compared to competitors like Soft Power Sweets, which improved its rank from 32 to 28 during the same period, and Kiva Chocolate, which climbed from 31 to 27. The sales figures for The Bettering Company have also shown a consistent decline, indicating potential challenges in maintaining customer engagement or market share. Meanwhile, 1906 and Gezoont have maintained relatively stable positions, suggesting that The Bettering Company may need to reassess its strategies to regain competitive ground in this dynamic market.

Notable Products
In March 2026, The Bettering Company's top-performing product was Laugh - Blackberry Lemonade Gummies 10-Pack (100mg), maintaining its consistent first-place ranking since December 2025, with sales of 995 units. Slumber - CBD/THC/CBN 2:2:1 Midnight Cherry Gummies 10-Pack (100mg CBD, 100mg THC, 50mg CBN) held steady in second place after climbing from third in February. Energize - THC/THCv 2:1 Lemon Zest Gummies 10-Pack (100mg THC, 50mg THCv) remained in third place, experiencing a decline in sales from the previous months. Create - THC/CBG 5:1 Raspberry Mandarin Gummies 10-Pack (100mg THC, 20mg CBG) consistently ranked fourth throughout the months analyzed. Notably, Energize - THC/THCv 2:1 Lemon Zest Gummies 2-Pack (20mg THC, 10mg THCv) debuted in fifth place in February, marking its first appearance in the rankings.
Top Selling Cannabis Brands
Data for this report comes from real-time sales reporting by participating cannabis retailers via their point-of-sale systems, which are linked up with Headset’s business intelligence software. Headset’s data is very reliable, as it comes digitally direct from our partner retailers. However, the potential does exist for misreporting in the instance of duplicates, incorrectly classified products, inaccurate entry of products into point-of-sale systems, or even simple human error at the point of purchase. Thus, there is a slight margin of error to consider. Brands listed on this page are ranked in the top twenty within the market and product category by total retail sales volume.

