.svg)

Sep-2026
Sales
Trend
6-Month
Product Count
SKUs
Avg Price
YoY Sales Change
YoY Price Change


Where to Buy
The Greenery Hash Factory is stocked at 94 licensed dispensaries across Colorado, with the deepest coverage in Denver, Boulder, Colorado Springs, Pueblo, and Trinidad. Search by ZIP code or city below to find the closest one, or filter by product type if you are after a specific format.
Market Insights Snapshot
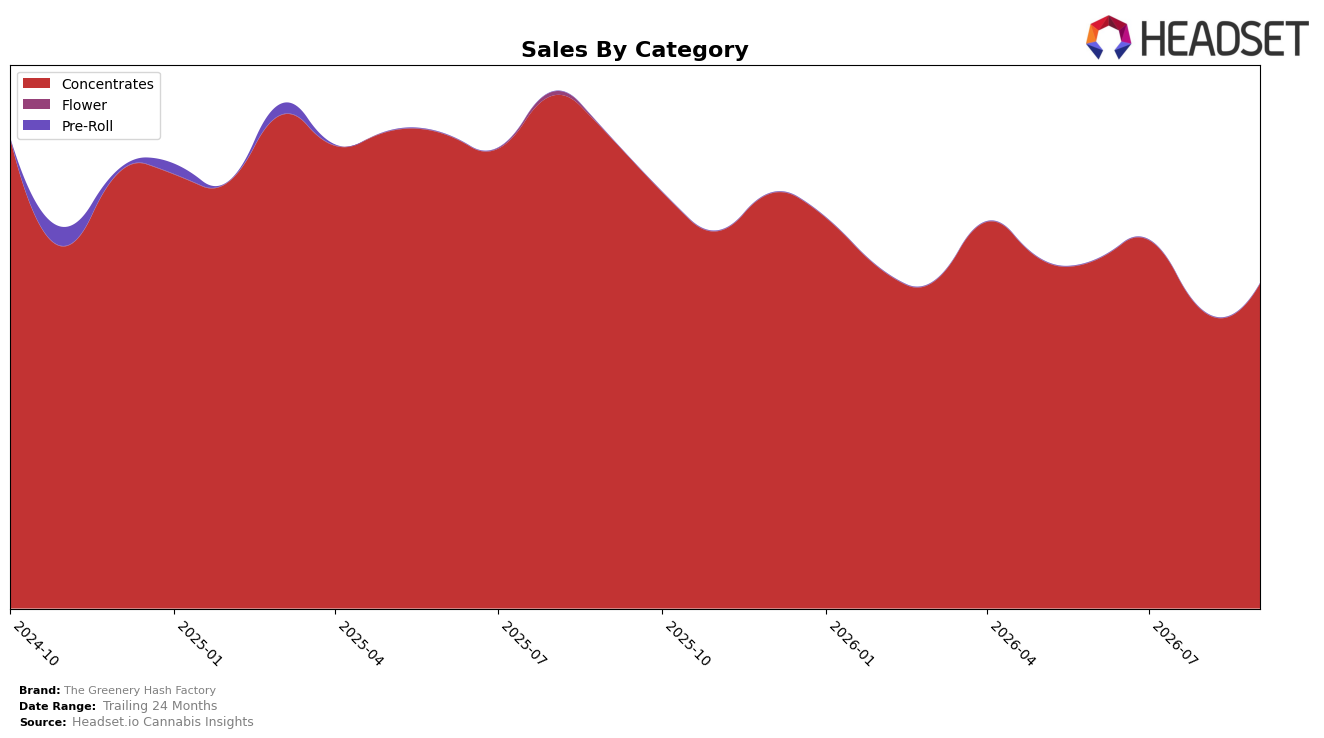
In September 2026, The Greenery Hash Factory operated as a single-category brand with Concentrates at 100.0% of sales, holding rank 25 in Colorado Concentrates. Within that category, year-over-year sales fell 31.48% while month-over-month sales rose 9.68%, paired with a 1.66% year-over-year decline in average price to $26.89. The juxtaposition of a 9.68% monthly lift against a 31.48% annual decline implies recent demand recovery inside a contracted base, suggesting the category concentration is amplifying volatility while keeping the brand squarely positioned as a Concentrates specialist.
The 100.0% reliance on Concentrates and a rank of 25 in Colorado indicate mid-pack visibility that improved month-over-month but trailed year-over-year trendlines by 31.48%. With average price down 1.66% year-over-year alongside a 9.68% monthly sales increase, the price stance likely aided short-term throughput without materially shifting share outside Concentrates. This mix implies a positioning thesis: maintain Concentrates focus while using incremental price or assortment tactics to convert the monthly momentum into rank gains from the current position of 25, rather than diversifying in ways that could dilute the brand’s established identity.
Competitive Landscape
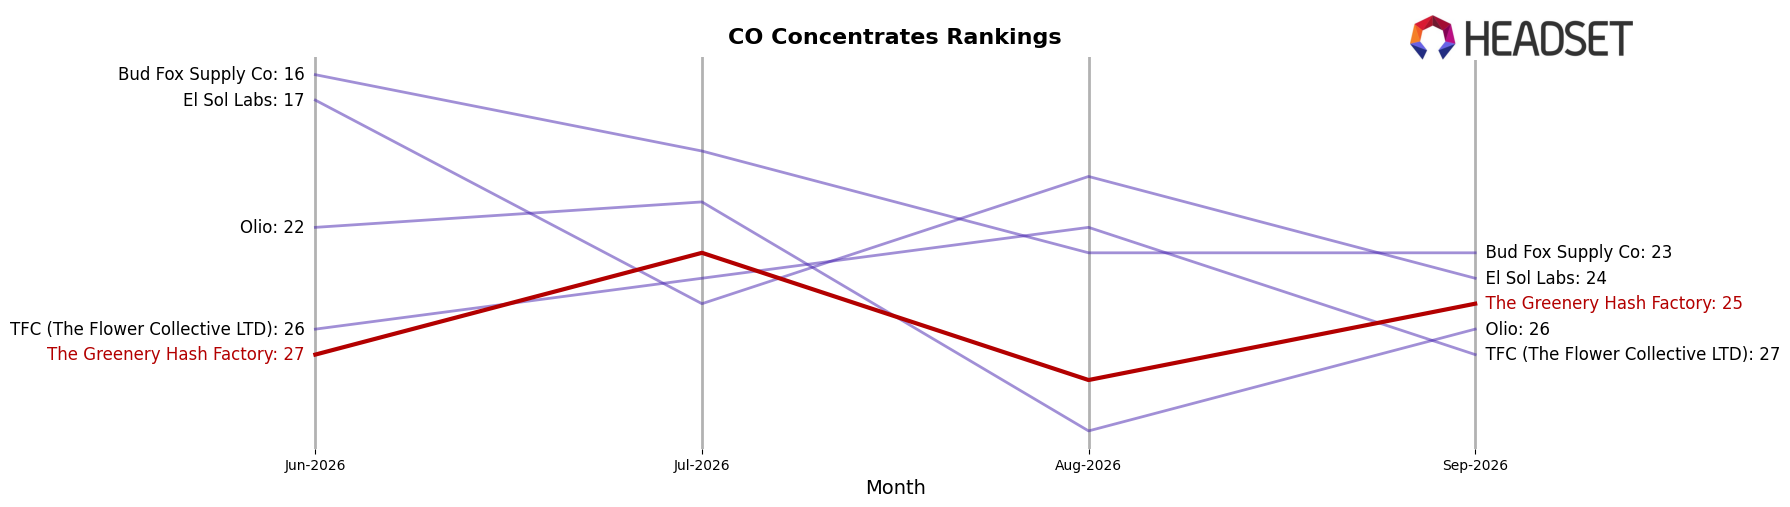
The Greenery Hash Factory is ranked #25 in CO Concentrates in September 2026, down 4 positions year over year from #21, while improving 2 spots from June 2026’s #27; this contrasts with 710 Labs holding #1 after rising from #2 year over year despite a 18.6% sales decline, and Sunshine Extracts advancing to #2 from #6 alongside a 49.9% sales increase. The Greenery Hash Factory last peaked at #18 in September 2024 and now sits 7 ranks below that peak, while Denver Dab Co moved from #8 to #4 with 56.8% sales growth and Billo climbed from #11 to #5 with 97.0% sales growth; the pattern implies The Greenery Hash Factory’s downward YoY rank shift amid competitors’ upward mobility points to share compression that requires either mix changes or pricing moves to arrest further rank erosion.
Notable Products
Lime Heads Moroccan Hash (1g) posted the standout move in September 2026 with a +140.5% month-over-month surge and rose to rank 1, while Grape Hindu Cake Lebanese Hash (1g) fell by -27.2% to rank 8; the spread between a triple-digit riser and a double-digit decliner signals a pivot toward Moroccan-style offerings over selected Lebanese variants. Across the top ten, all items sit in Concentrates and at least six are Lebanese Hash SKUs clustered between ranks 2 and 9, while Cake Pie Moroccan Hash (1g) added +35.1% at rank 4 and Sugar Straw Lebanese Hash (1g) gained +20.4% at rank 7, with category concentration suggesting portfolio depth but uneven momentum by strain lineage. With the top rank tied to a Moroccan SKU and the steepest decline tied to a Lebanese SKU, the mix implies The Greenery Hash Factory is shifting commercial emphasis toward Moroccan executions and pruning underperforming Lebanese strains.
Top Selling Cannabis Brands






Data for this report comes from real-time sales reporting by participating cannabis retailers via their point-of-sale systems, which are linked up with Headset’s business intelligence software. Headset’s data is very reliable, as it comes digitally direct from our partner retailers. However, the potential does exist for misreporting in the instance of duplicates, incorrectly classified products, inaccurate entry of products into point-of-sale systems, or even simple human error at the point of purchase. Thus, there is a slight margin of error to consider. Brands listed on this page are ranked in the top twenty within the market and product category by total retail sales volume.

