Market Insights Snapshot
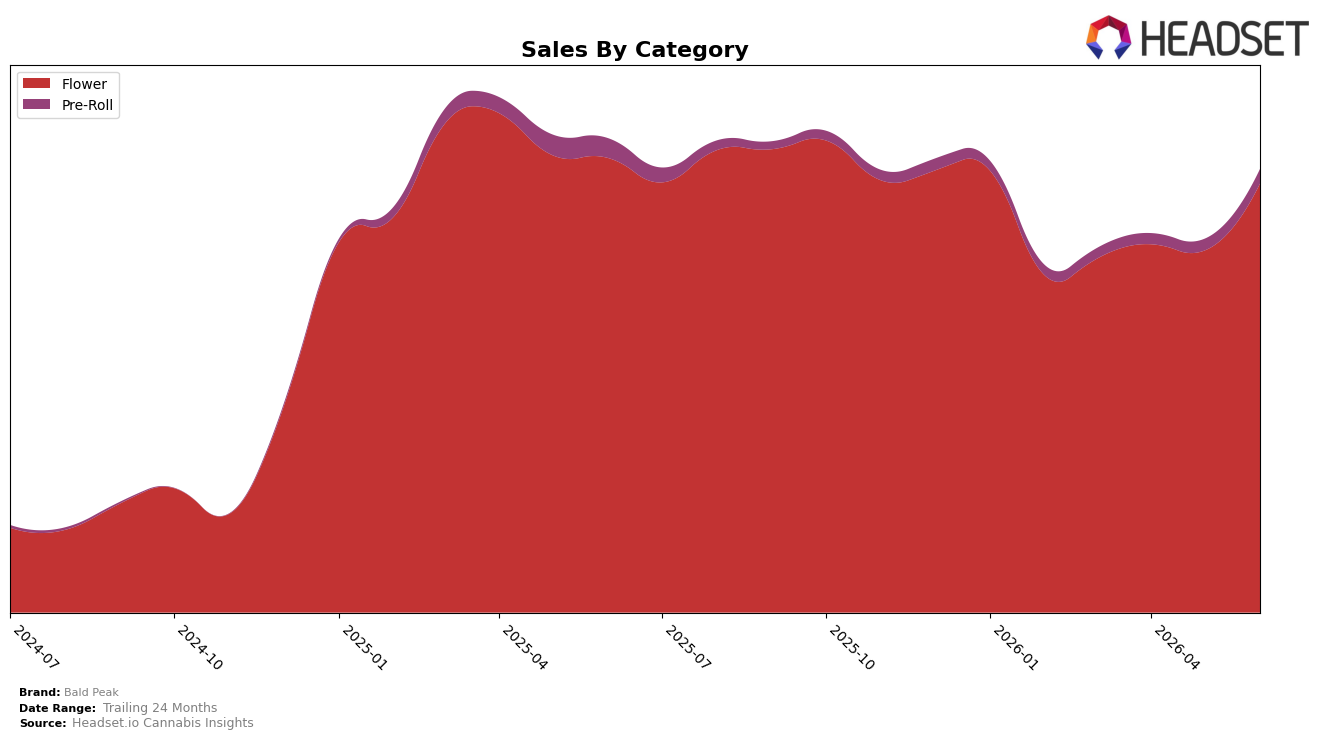
Bald Peak concentrated 96.51% of June 2026 sales in Flower while Pre-Roll held 3.49%, with Flower down 5.61% year over year but up 18.43% month over month and Pre-Roll down 25.04% year over year but up 22.58% month over month. Despite a 6.46% brand-level year-over-year decline and a 7.53% drop in average price, the category mix stayed narrow, and the Flower rank in Oregon sat at rank 3, implying reliance on Flower momentum to offset pricing compression.
The combination of an 18.43% month-over-month Flower lift and a 22.58% month-over-month Pre-Roll lift, alongside a 7.53% lower average price and a rank of 3 in Oregon Flower, implies a volume-led strategy that trades price for share defense. With Flower’s 96.51% share versus Pre-Roll’s 3.49%, and year-over-year declines of 5.61% in Flower and 25.04% in Pre-Roll, the mix signals a need to deepen premium Flower tiers or rationalize Pre-Roll SKUs, as current pricing tactics risk eroding revenue velocity even if short-term rank stability is maintained.
Competitive Landscape
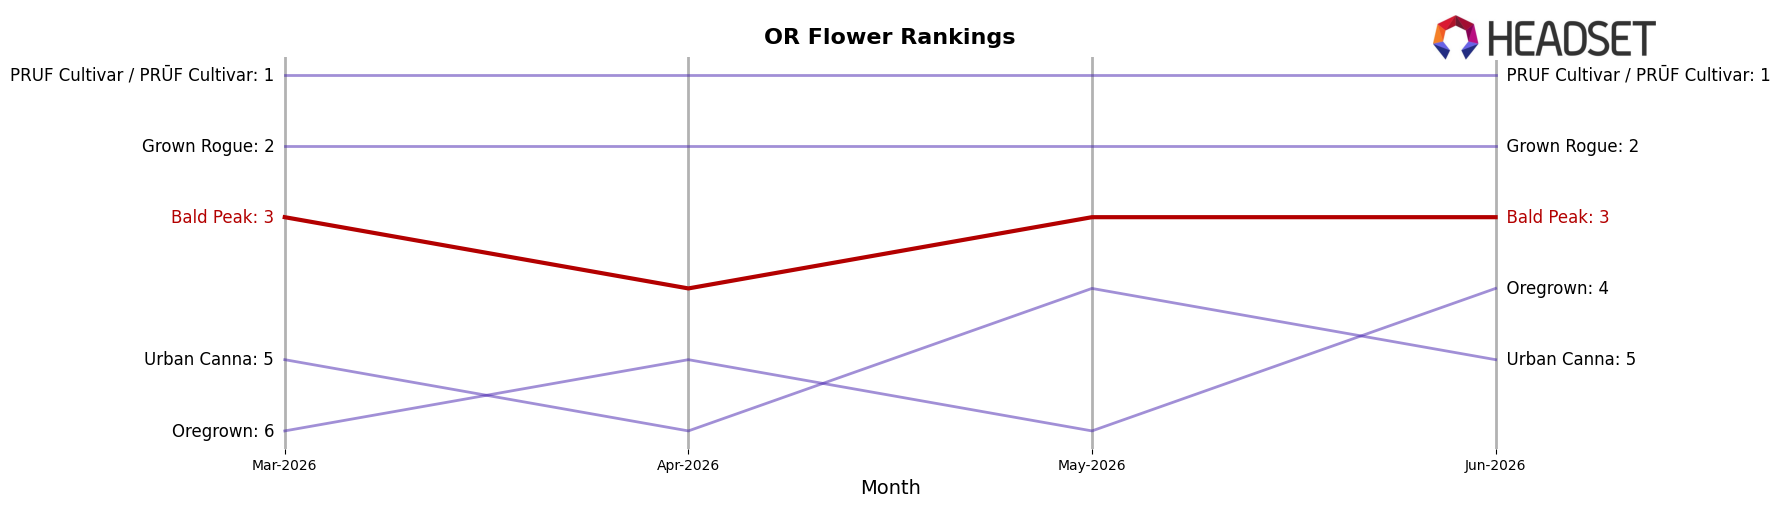
Bald Peak is ranked #3 in OR Flower in June 2026, unchanged YoY from #3, and it held #3 three months ago as well, while its peak rank of #2 came in January 2026; in contrast, Grown Rogue climbed from #6 YoY to #2 and PRUF Cultivar / PRŪF Cultivar held #1 with an 18.7% YoY sales increase, indicating that Bald Peak’s flat rank alongside upward moves above it and pressure from Oregrown at #4 (+9.7% YoY sales) implies a stable but squeezed position where holding share will require countering faster climbers.
Notable Products
Mandarin Grape Gelato (1g) posted the largest month-over-month surge at 102.0% to reach rank 2, while Papaya x Honey Bananas (1g) rose 80.3% to hold rank 1, indicating acceleration at the very top of the lineup. Birthday Cake (1g) advanced 65.9% into rank 5, and Deadhead OG (1g) increased 30.2% at rank 6, whereas Maui Melon Bubblegum (1g) slipped 5.2% at rank 7, showing gains are concentrated above the mid-pack. With ten of the top ten SKUs in Flower and the top two both growing over +80% combined month-over-month, the mix points to a push toward higher-velocity Flower strains rather than broad category diversification.
Top Selling Cannabis Brands
Data for this report comes from real-time sales reporting by participating cannabis retailers via their point-of-sale systems, which are linked up with Headset’s business intelligence software. Headset’s data is very reliable, as it comes digitally direct from our partner retailers. However, the potential does exist for misreporting in the instance of duplicates, incorrectly classified products, inaccurate entry of products into point-of-sale systems, or even simple human error at the point of purchase. Thus, there is a slight margin of error to consider. Brands listed on this page are ranked in the top twenty within the market and product category by total retail sales volume.

