May-2026
Sales
Trend
6-Month
Product Count
SKUs
Avg Price
YoY Sales Change
YoY Price Change
Market Insights Snapshot
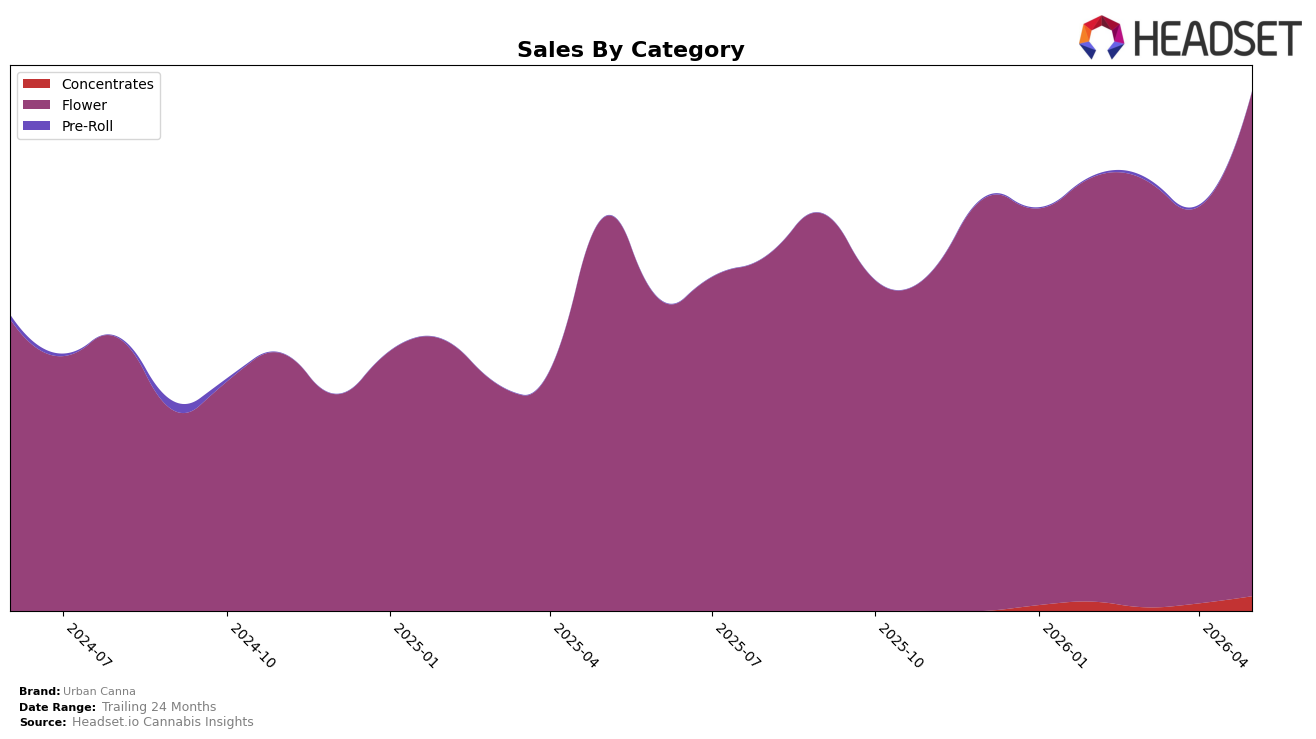
Urban Canna’s mix in Oregon in May 2026 was concentrated in Flower at 97.12% share, with Flower growing 28.33% year over year and 27.21% month over month, while Concentrates held 2.84% share with a 94.53% month-over-month surge and Pre-Roll at 0.04% share fell 83.89% month over month despite a 94.88% year-over-year gain. Average price rose 6.91% year over year to $31.32 as Flower averaged $31.01 and Concentrates averaged $48.57, aligning with total brand sales up 32.09% year over year and Flower’s category-specific growth of 28.33%; together, these shifts imply Urban Canna is leaning into premiumized Flower while selectively expanding into Concentrates as a secondary volume lever.
The category skew supports a positioning anchored in Flower where Urban Canna holds rank 4 in Oregon Flower, with the 27.21% month-over-month Flower lift paired with a 94.53% month-over-month rise in Concentrates indicating a trial-based or limited distribution push rather than a broad portfolio pivot, given Concentrates remain below 3% share. With Pre-Roll volatility (down 83.89% month over month but up 94.88% year over year) alongside a 6.91% average price increase and a 32.09% year-over-year sales gain, the pattern implies a price-tolerant core in Flower supplemented by opportunistic, higher-ticket Concentrates that can add incremental growth without diluting the brand’s Flower-focused identity.
Competitive Landscape
Urban Canna sits at rank #4 in OR Flower in May 2026, improving 2 positions year over year from #6 while also rising 2 spots versus February 2026, and hitting its peak rank of #4 in May 2026; meanwhile, PRUF Cultivar / PRŪF Cultivar held #1 with a 23.9% YoY sales increase and Grown Rogue advanced to #2 from #7 with a 51.1% YoY lift, indicating Urban Canna’s gains are occurring amid faster upward movement from rivals. Compared with Bald Peak sliding to #3 from #2 alongside a 12.6% YoY sales decline and Otis Garden climbing to #5 from #20 on 101.4% YoY growth, the competitive gap around ranks #3–#5 is tightening, implying Urban Canna’s current trajectory requires continued share defense or incremental gains to avoid being overtaken despite the 2-rank YoY improvement.

Notable Products
GMO (1g) posted the standout movement in May 2026 with a 273% month-over-month surge to $152,542 and jumped to rank 1, while Gelato Cake (1g) also accelerated 115% and held rank 7. Hash Burger (Bulk) rose 69% to rank 3, contrasting with Blue Inferno (Bulk) slipping 6% to rank 2. With all top-10 items in Flower and three 1g SKUs sitting in the top 10, the pattern implies Urban Canna is tilting toward smaller pack formats driving velocity at the top of the leaderboard.
Top Selling Cannabis Brands
Data for this report comes from real-time sales reporting by participating cannabis retailers via their point-of-sale systems, which are linked up with Headset’s business intelligence software. Headset’s data is very reliable, as it comes digitally direct from our partner retailers. However, the potential does exist for misreporting in the instance of duplicates, incorrectly classified products, inaccurate entry of products into point-of-sale systems, or even simple human error at the point of purchase. Thus, there is a slight margin of error to consider. Brands listed on this page are ranked in the top twenty within the market and product category by total retail sales volume.

