.svg)
Jul-2026
Sales
Trend
6-Month
Product Count
SKUs
Avg Price
YoY Sales Change
YoY Price Change


Market Insights Snapshot
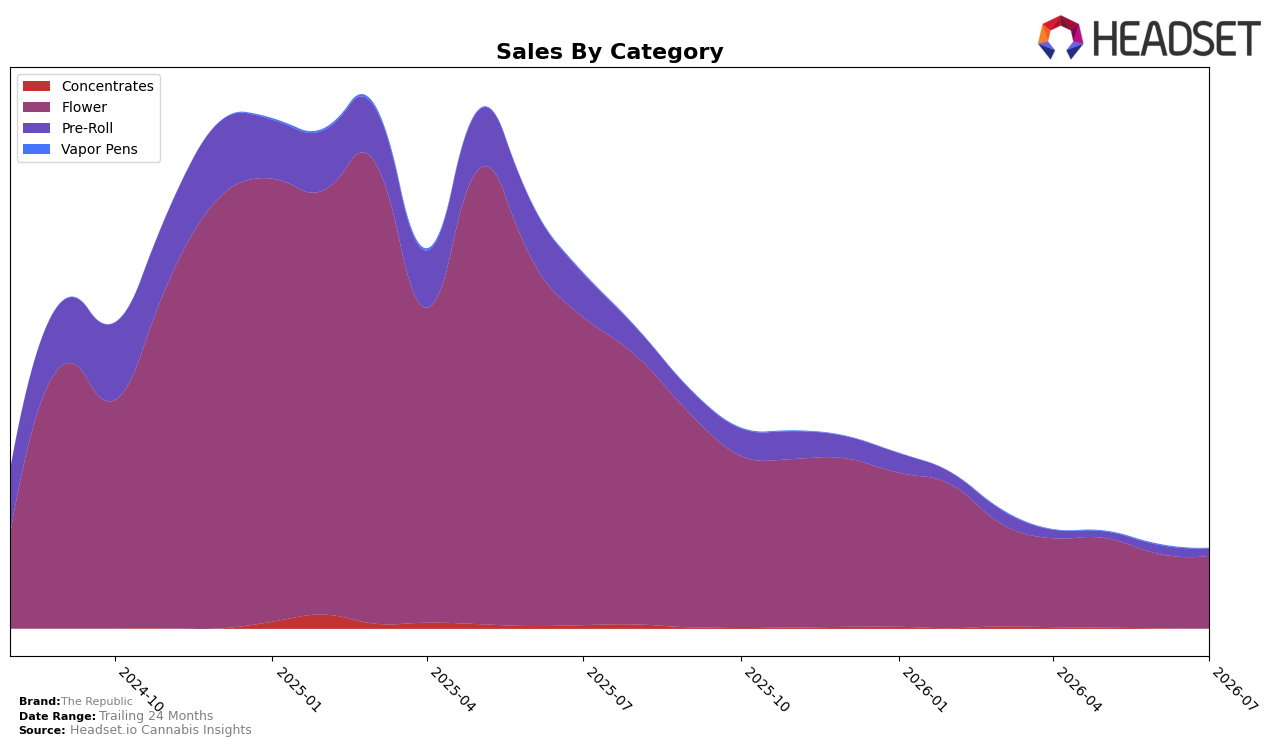
In July 2026, The Republic concentrated 90.89% of sales in Flower while Pre-Roll accounted for 9.11%, with Flower down 76.55% year over year and 2.76% month over month, and Pre-Roll declining 83.21% year over year and 16.14% month over month. Overall brand sales fell 77.65% year over year, while the average price rose 3.76%, and Flower’s average price at $95.12 contrasts with Pre-Roll at $12.78, indicating a premium-weighted mix despite a 32.67% two-year sales decline. This pattern implies overexposure to a contracting Flower base and price resilience that is not converting to volume, concentrating risk in a single category while dampening recovery potential.
The 49th rank in Flower within Saskatchewan alongside a 76.55% Flower decline and a 16.14% month-over-month drop in Pre-Roll in July 2026 points to weakening competitive position in the core category and limited cushioning from the smaller format. With 90.89% share tied to Flower and only 9.11% in Pre-Roll, the mix skews toward higher-ticket items where a 3.76% brand-wide price lift and a $95.12 Flower average price may be elevating elasticity, especially as Pre-Roll underperforms month over month. This configuration implies The Republic’s positioning is drifting toward niche, higher-price Flower rather than a balanced basket, reducing rank headroom and leaving the brand sensitive to further share loss unless mix broadens or Flower sell-through stabilizes.
Competitive Landscape
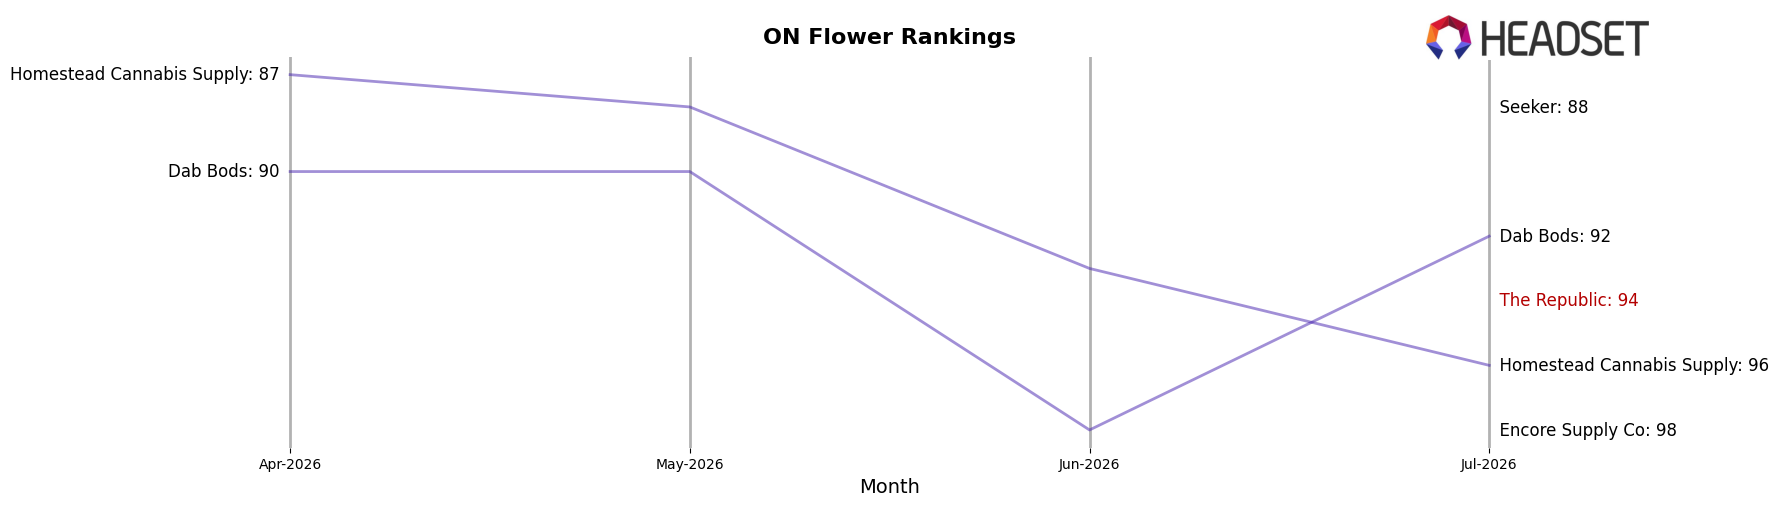
The Republic ranks #94 in Ontario Flower in July 2026, sliding 43 positions year over year from #51, yet improving 14 spots since April 2026 when it sat at #108; against that backdrop, Shred moved up to #1 from #2 with 17.2% YoY sales growth while Spinach advanced to #2 from #4 on 31.1% YoY growth, indicating that gains at the top are consolidating as The Republic drifts away from its peak rank of #35 in January 2025 and toward the lower tier, implying the brand’s rank trajectory reflects erosion in relative velocity that will be hard to reverse without a mix or pricing reset aligned to leaders’ momentum.
Notable Products
Black label (28g) delivered the headline move in July 2026 with a 296% month-over-month surge that vaulted it to rank 5, while Reserve 25%+ Milled (28g) slid 33% yet still held rank 4. Reserve 25%+ (28g) eased 6% at rank 1, and 25 Plus Pre-Roll 2-Pack (2g) fell 10% at rank 3; across the top ten, Flower items occupy 4 positions, concentrating gains and losses in one category. Republic Reserve Pre-Roll 10-Pack (5g) declined 50% to rank 7, contrasting with the modest 4% uptick for Black Label (7g) at rank 6, and this divergence implies a pivot toward larger-format Flower while multi-pack Pre-Rolls retrench. The pattern suggests The Republic is consolidating around high-potency, larger-size Flower as its commercial anchor, using the Black Label portfolio to offset softness in Pre-Rolls.
Top Selling Cannabis Brands






Data for this report comes from real-time sales reporting by participating cannabis retailers via their point-of-sale systems, which are linked up with Headset’s business intelligence software. Headset’s data is very reliable, as it comes digitally direct from our partner retailers. However, the potential does exist for misreporting in the instance of duplicates, incorrectly classified products, inaccurate entry of products into point-of-sale systems, or even simple human error at the point of purchase. Thus, there is a slight margin of error to consider. Brands listed on this page are ranked in the top twenty within the market and product category by total retail sales volume.

