Jun-2026
Sales
Trend
6-Month
Product Count
SKUs
Avg Price
YoY Sales Change
YoY Price Change
Market Insights Snapshot
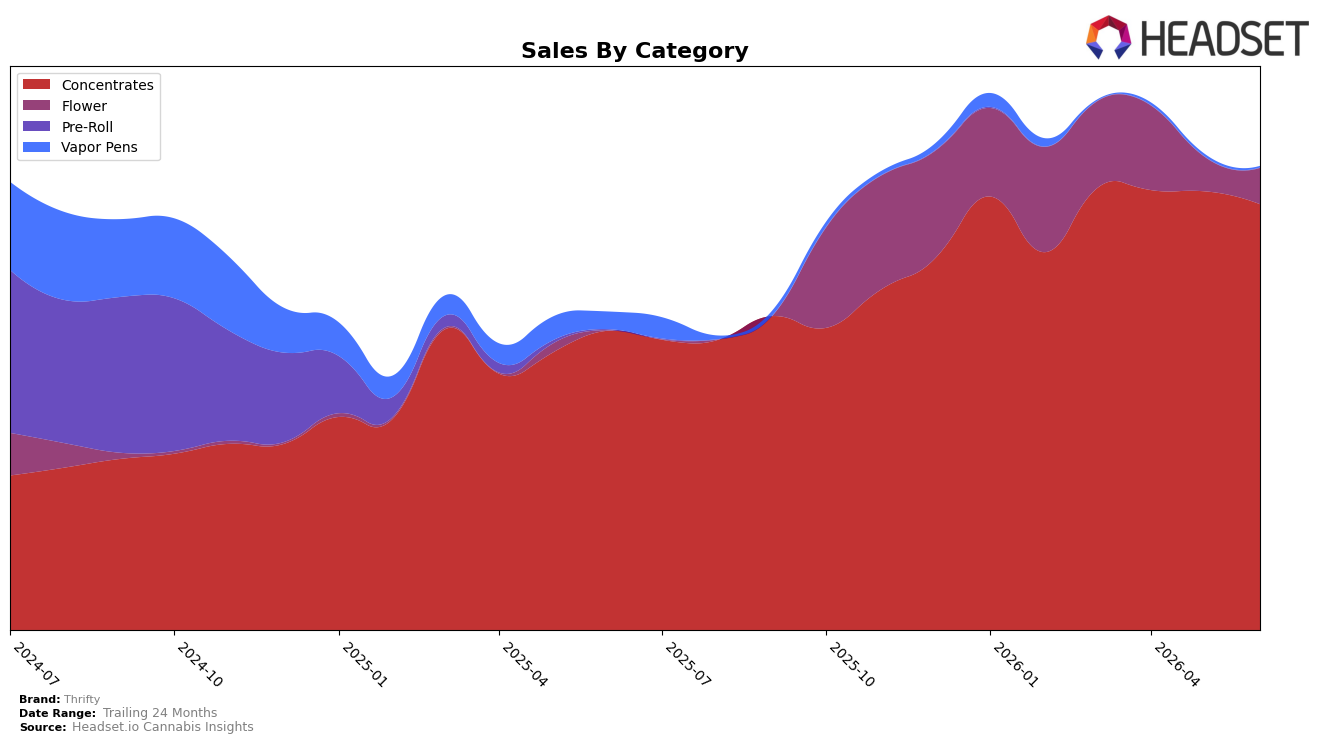
In June 2026, Thrifty concentrated 91.98% of sales in Concentrates, where category sales grew 42.34% year over year but slipped 2.94% month over month, while Flower expanded to a 7.75% share on a 5.30% month-over-month gain despite no year-over-year benchmark. Vapor Pens contracted to 0.26% share with a 93.02% year-over-year decline and a 44.45% month-over-month drop, even as the brand’s average price rose 6.39% year over year and overall brand sales advanced 45.98% year over year. With Concentrates ranked 6th in Ontario, the mix signals a scale advantage in a single category but introduces sensitivity to short-term pullbacks; the pattern implies Thrifty’s growth engine is highly concentrated, with nascent diversification in Flower not yet offsetting volatility in Vapor Pens.
Given a 91.98% reliance on Concentrates alongside a 2.94% month-over-month dip, the portfolio’s risk is tied to single-category swings, while the 5.30% month-over-month lift in Flower offers a hedge that is currently too small at 7.75% share to materially change exposure. The 6.39% year-over-year increase in average price alongside a 45.98% year-over-year sales gain suggests volume rather than pricing is carrying growth, implying runway in Ontario if rank 6 can be converted to higher share without eroding price; the pattern implies Thrifty’s near-term positioning hinges on deepening Concentrates penetration while deliberately scaling Flower to dampen month-level volatility.
Competitive Landscape
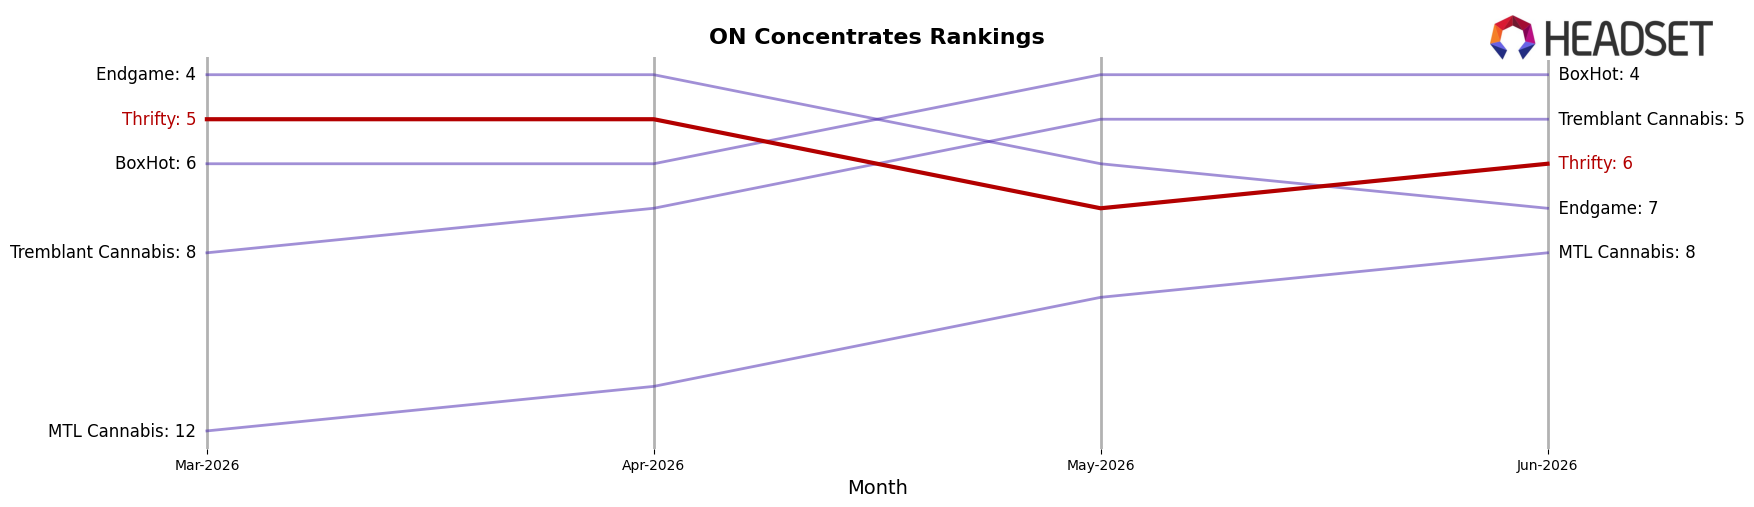
Thrifty sits at rank #6 in ON Concentrates in June 2026, improving 3 positions year over year from #9 and slipping 1 position from its three-month mark at #5, while its peak of #5 in April 2026 indicates recent marginal softening; by contrast, Pura Vida advanced from #4 to #2 alongside a 49% YoY sales gain and BoxHot rose from #8 to #4 with a 44% YoY lift, whereas category leader Vortex Cannabis Inc. held #1 with a 2% YoY sales decline and Nugz (Canada) slid from #2 to #3 with a 7% YoY sales pullback; the juxtaposition of Thrifty’s 3-rank YoY climb and 1-rank quarter-over-quarter dip implies a mid-pack position vulnerable to faster risers, making retention of April 2026’s #5 threshold the pivotal indicator of whether momentum consolidates or reverts.
Notable Products
Thrifty’s Mango Sapphire (28g) posted the standout move in June 2026 with a 103.2% MoM surge that pushed it to rank 4, while Bonkers (28g) vaulted 229.3% MoM into a tie at rank 6, indicating Flower regained share at the expense of several declining formats. In contrast, Big Steal Live Rosin (1g) fell 20.4% MoM at rank 3 and Big Steal Infused Hash (1.75g) collapsed 86.4% MoM at rank 5, even as Big Steal Live Resin (1g) in Concentrates inched up 3.0% MoM at rank 1, a split that points to price-tier or form-factor substitution within extracts. With three Concentrates in the top five but two posting double-digit declines and two Flower SKUs jumping triple digits, the mix implies Thrifty is pivoting toward value-driven large-format Flower to stabilize volume while relying less on premium or niche concentrate subtypes.
Top Selling Cannabis Brands
Data for this report comes from real-time sales reporting by participating cannabis retailers via their point-of-sale systems, which are linked up with Headset’s business intelligence software. Headset’s data is very reliable, as it comes digitally direct from our partner retailers. However, the potential does exist for misreporting in the instance of duplicates, incorrectly classified products, inaccurate entry of products into point-of-sale systems, or even simple human error at the point of purchase. Thus, there is a slight margin of error to consider. Brands listed on this page are ranked in the top twenty within the market and product category by total retail sales volume.

