Market Insights Snapshot
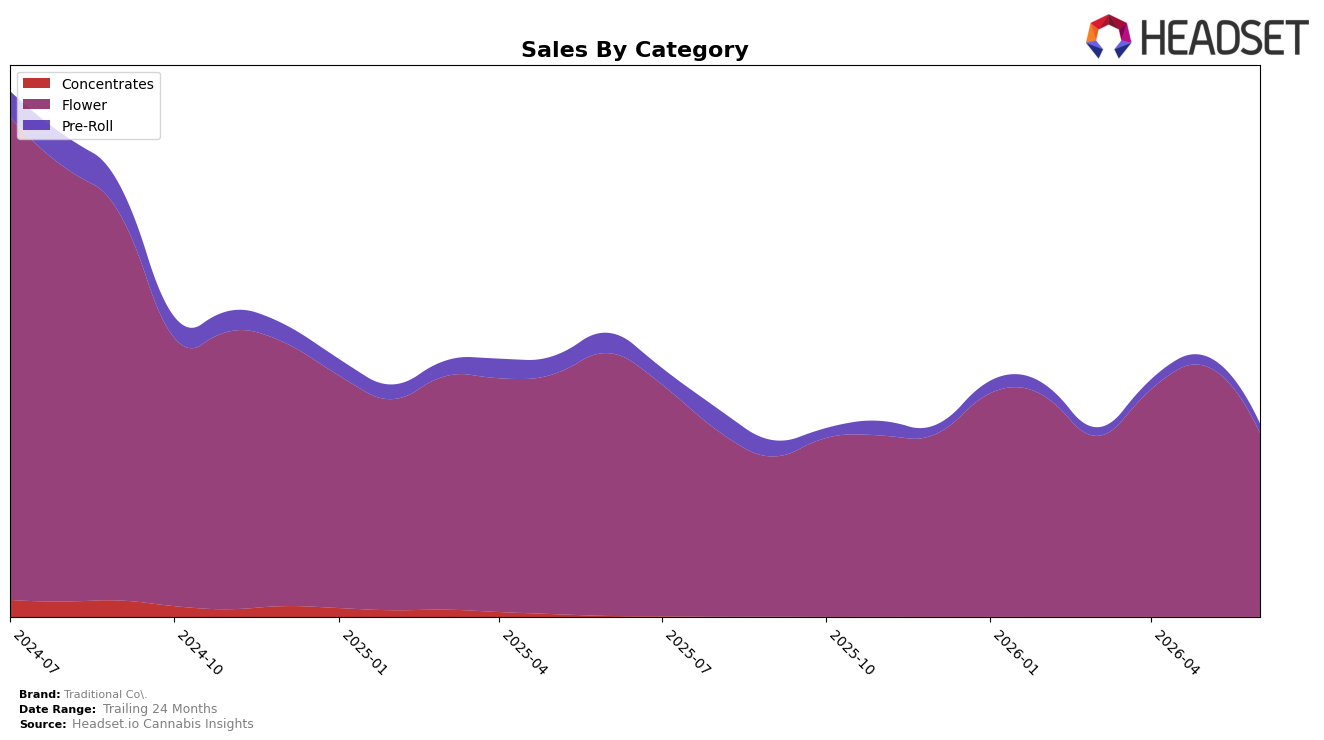
In June 2026, Traditional Co. concentrated 95.21% of sales in Flower, with Pre-Roll at 4.79%, while Flower declined 30.08% year over year and 26.81% month over month and Pre-Roll fell 53.62% year over year and 5.43% month over month; the overall brand sales decline of 31.97% year over year alongside a 6.52% rise in average price indicates demand contraction outpacing any price lift. Within the Flower category in California, the brand sat at rank 29, and with a 24‑month sales change of -60.67% and Flower’s average price at $31.70 versus the brand average price level, the mix skews toward higher-priced Flower that is losing volume faster than the smaller Pre-Roll segment, implying an over-reliance on a contracting core.
These shifts imply that Traditional Co.’s positioning is tethered to Flower at rank 29, where a -26.81% month-over-month contraction combined with a -30.08% year-over-year decline suggests shelf velocity and distribution pressure that a 6.52% brand-wide price increase is not offsetting. With Pre-Roll at only 4.79% share but declining a shallower 5.43% month over month than Flower’s 26.81%, the current trajectory points to a need for mix diversification and price-pack architecture adjustments to stabilize rank in California and reduce exposure to category-specific volatility.
Competitive Landscape
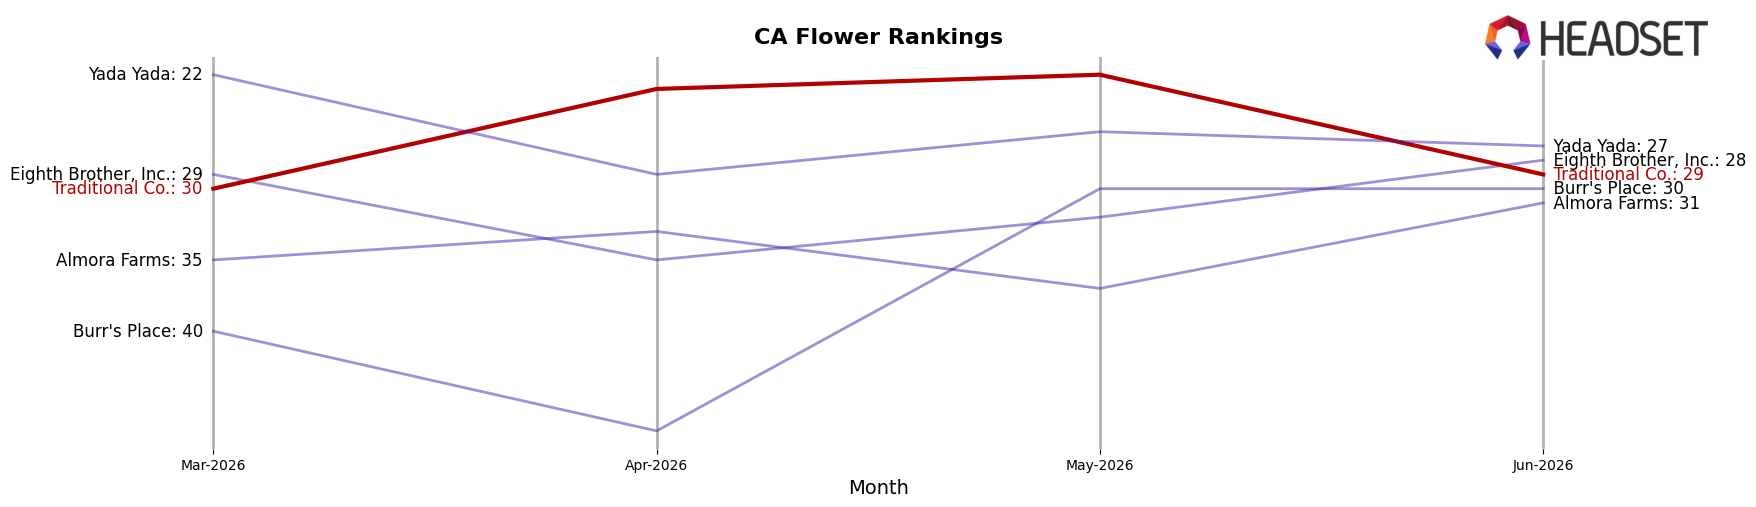
Traditional Co. sits at rank #29 in California Flower in June 2026, down 6 positions year over year from #23 and effectively flat versus March 2026 at #30, while its peak of #11 in July 2024 underscores a 18-place slide from its historical best; in contrast, STIIIZY holds #1 after improving from #2 year over year and CAM rose from #3 to #2 with 56.2% YoY sales growth, indicating that leadership brands are moving up as Traditional Co. drifts down the ladder, implying its trajectory points to share consolidation at the top unless rank momentum reverses.
Notable Products
Rainbow Runtz (3.5g) posted the steepest decline in June 2026 at -42.0% while sliding to rank 4, paired with Gelato (3.5g) falling -41.4% at rank 9, which together signal a retreat for previously faster-turning flavor SKUs. Strawberry Milkshake (3.5g) also contracted -35.1% yet held rank 1, contrasting with Cotton Censored (3.5g) rising 12.1% to rank 7, and six of the top ten are Flower SKUs concentrated in 3.5g and 5g formats. With top-tier units declining double-digits while mid-pack Cotton Censored (3.5g) grows, the mix points to a pivot from hero strains toward a broader, value-leaning Flower lineup that spreads volume beyond a few headliners.
Top Selling Cannabis Brands
Data for this report comes from real-time sales reporting by participating cannabis retailers via their point-of-sale systems, which are linked up with Headset’s business intelligence software. Headset’s data is very reliable, as it comes digitally direct from our partner retailers. However, the potential does exist for misreporting in the instance of duplicates, incorrectly classified products, inaccurate entry of products into point-of-sale systems, or even simple human error at the point of purchase. Thus, there is a slight margin of error to consider. Brands listed on this page are ranked in the top twenty within the market and product category by total retail sales volume.

