Market Insights Snapshot
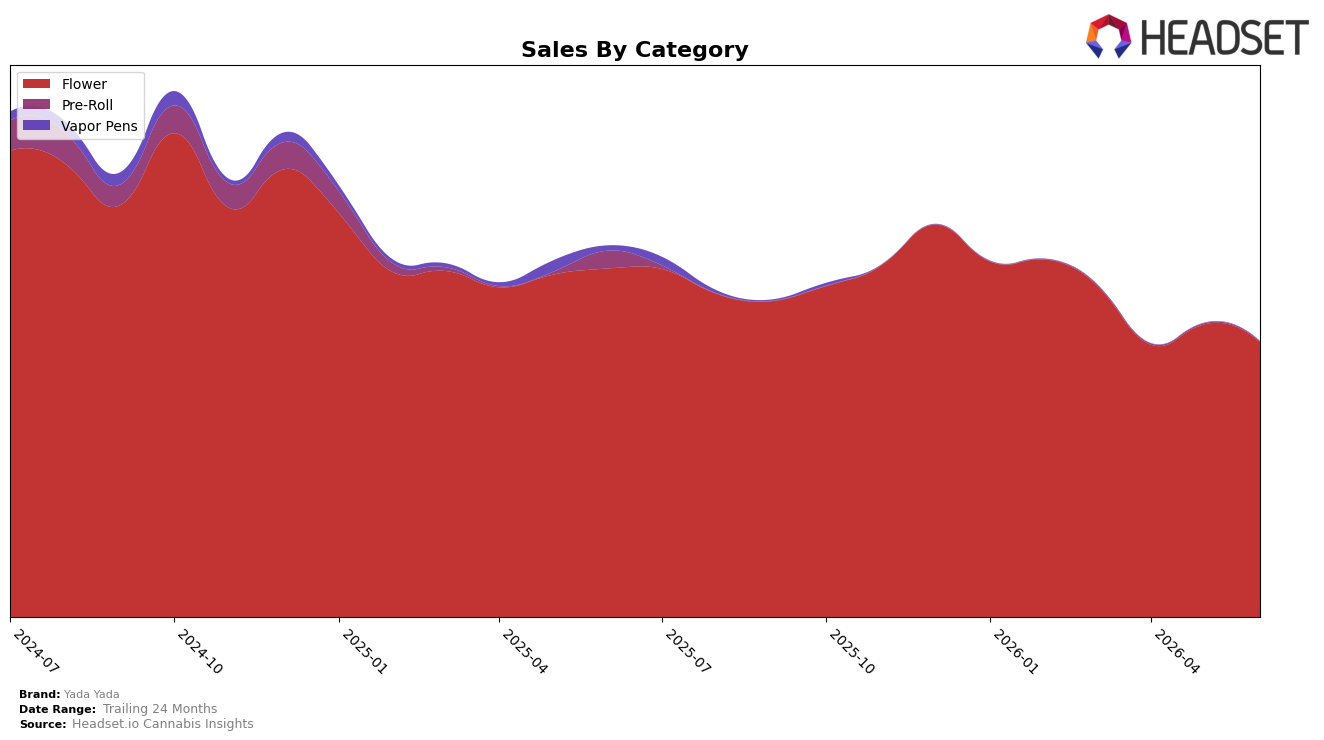
In June 2026, Yada Yada concentrated 99.82% of sales in Flower while Pre-Roll fell to 0.18% share, with Flower down 21.20% YoY and 6.14% MoM and Pre-Roll down 97.21% YoY and 40.60% MoM. Despite a 2.46% YoY rise in average price to $18.09, brand sales declined 25.79% YoY and 43.77% over 24 months, indicating that mix concentration in Flower and price creep did not offset unit pressure. The thesis is that a near-single-category dependence combined with negative MoM and YoY trajectories in both categories signals vulnerability to further share erosion if category breadth and pricing architecture are not recalibrated.
With a Flower rank of 27 in California and a 6.14% MoM decline against a 21.20% YoY drop, the brand’s recent cadence suggests stabilization attempts that are not yet translating into rank gains. The 0.18% Pre-Roll share paired with a 97.21% YoY contraction removes an entry-price and trial onramp that could buffer a 2.46% YoY price increase in Flower, and the 43.77% 24‑month sales slide implies accumulated underperformance that outpaces short-term pricing benefits. The thesis is that Yada Yada’s positioning is drifting toward a mid-pack Flower specialist without a feeder subcategory, which compresses discovery and repeat velocity and makes incremental rank improvement contingent on restoring a secondary format rather than further price moves.
Competitive Landscape
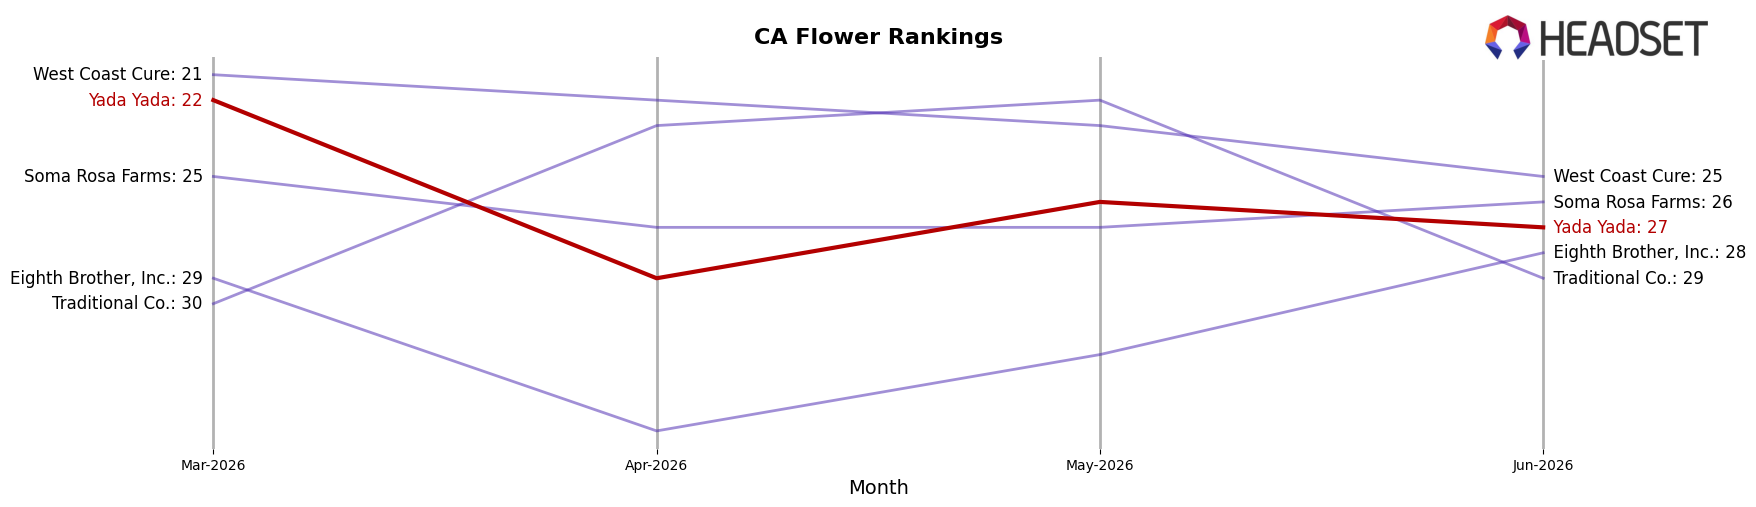
Yada Yada sits at rank #27 in CA Flower in June 2026, down 2 positions year over year from #25 and 5 spots below its March-to-June trend peak of #22, while also trailing its February 2026 peak rank of #19 by 8 places; meanwhile, category leaders moved upward, with STIIIZY climbing from #2 to #1 alongside a 62.5% YoY sales gain and CAM improving from #3 to #2 with a 56.2% YoY lift, indicating Yada Yada’s relative share is slipping as top-tier momentum concentrates at the front of the rankings, which implies the brand’s trajectory points to further mid-pack compression unless it reverses the 2-rank YoY decline and closes the 8-position gap to its February 2026 ceiling.
Notable Products
GovernMint Oasis Smalls (20g) posted the steepest decline in June 2026 at -22.8% while sliding to rank 3, and Chapel of Love Pre-Ground (14g) fell -21.3% as Chapel of Love Small (20g) dropped -14.1% to rank 8, together signaling erosion in two lines that had anchored mid-tier volume. In contrast, Black Amber Pre-Ground (14g) grew 26.3% to hold rank 1 and GMO Shake (14g) rose 25.6% at rank 4, indicating that value-oriented grinds are absorbing share as smalls contract. With eight of the top ten SKUs in Flower and at least four of the top ten concentrated in pre-ground formats, the mix is tilting toward convenience segments rather than bulk smalls. This pattern implies Yada Yada is consolidating leadership around pre-ground Flower while de-emphasizing larger-format smalls that are losing momentum.
Top Selling Cannabis Brands
Data for this report comes from real-time sales reporting by participating cannabis retailers via their point-of-sale systems, which are linked up with Headset’s business intelligence software. Headset’s data is very reliable, as it comes digitally direct from our partner retailers. However, the potential does exist for misreporting in the instance of duplicates, incorrectly classified products, inaccurate entry of products into point-of-sale systems, or even simple human error at the point of purchase. Thus, there is a slight margin of error to consider. Brands listed on this page are ranked in the top twenty within the market and product category by total retail sales volume.

