
Sep-2026
Sales
Trend
6-Month
Product Count
SKUs
Avg Price
YoY Sales Change
YoY Price Change


Where to Buy
Tribe 710 is stocked at 191 licensed dispensaries across Oklahoma and California, 158 of them in Oklahoma, with the deepest coverage in Oklahoma City, Tulsa, Norman, Broken Arrow, and Edmond. Search by ZIP code or city below to find the closest one, or filter by product type if you are after a specific format.
Market Insights Snapshot
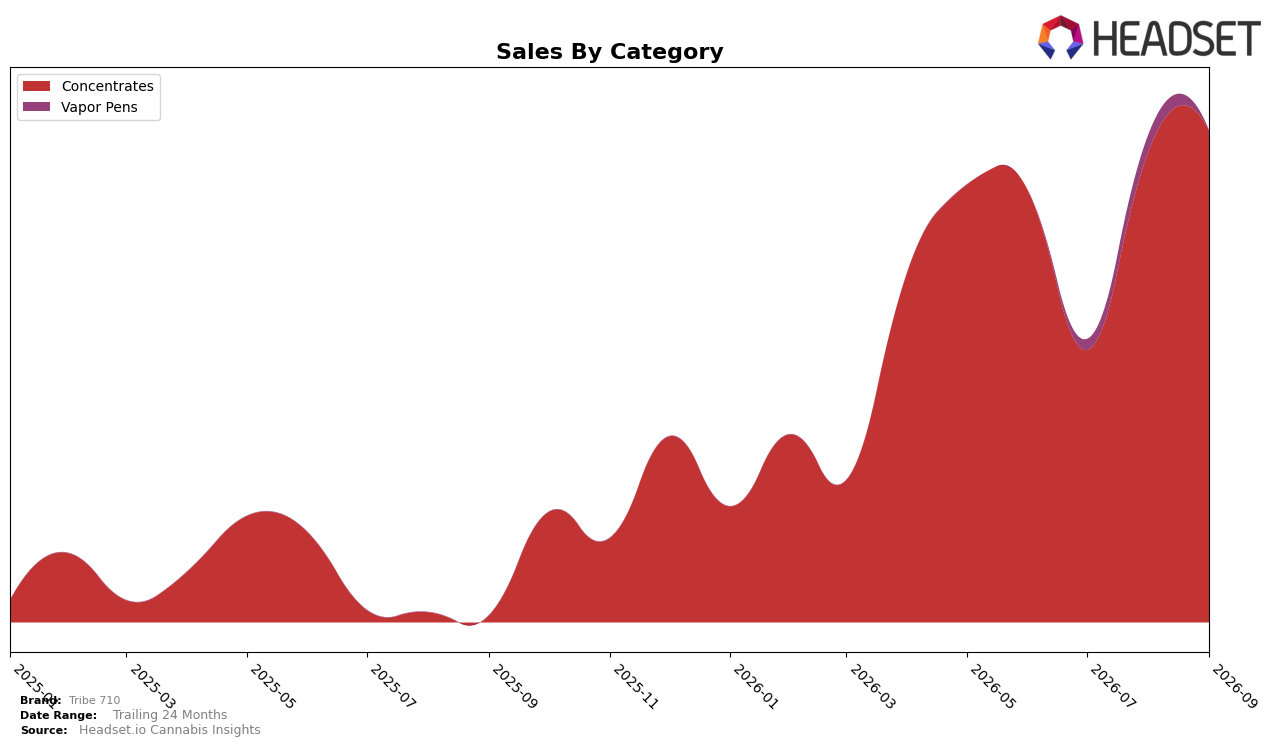
Tribe 710 operated as a single-category brand in September 2026, with Concentrates holding 100.0% of sales and an average price down 2.1% year over year while unit velocity expanded, evidenced by a 6,813.99% year-over-year sales increase and a 4.46% month-over-month gain. Within California Concentrates, the brand sat at rank 41, pairing that mid-pack position with a full-category commitment that limits diversification risk offset but concentrates momentum within one product type; the implication is that growth is being driven by depth in a single lane rather than breadth across categories.
The combination of a 6,813.99% year-over-year surge alongside a 2.1% price decline and a 4.46% month-over-month uptick indicates demand expansion driven more by unit growth than pricing, positioning Tribe 710 as a volume-led player in California Concentrates. Holding 100.0% of mix in Concentrates while sitting at rank 41 signals room to climb via assortment depth and subsegment targeting within Concentrates rather than immediate category diversification; the near-term positioning thesis is to convert unit-led gains into sustained rank improvement while maintaining price discipline that supported both the year-over-year and month-over-month advances.
Competitive Landscape
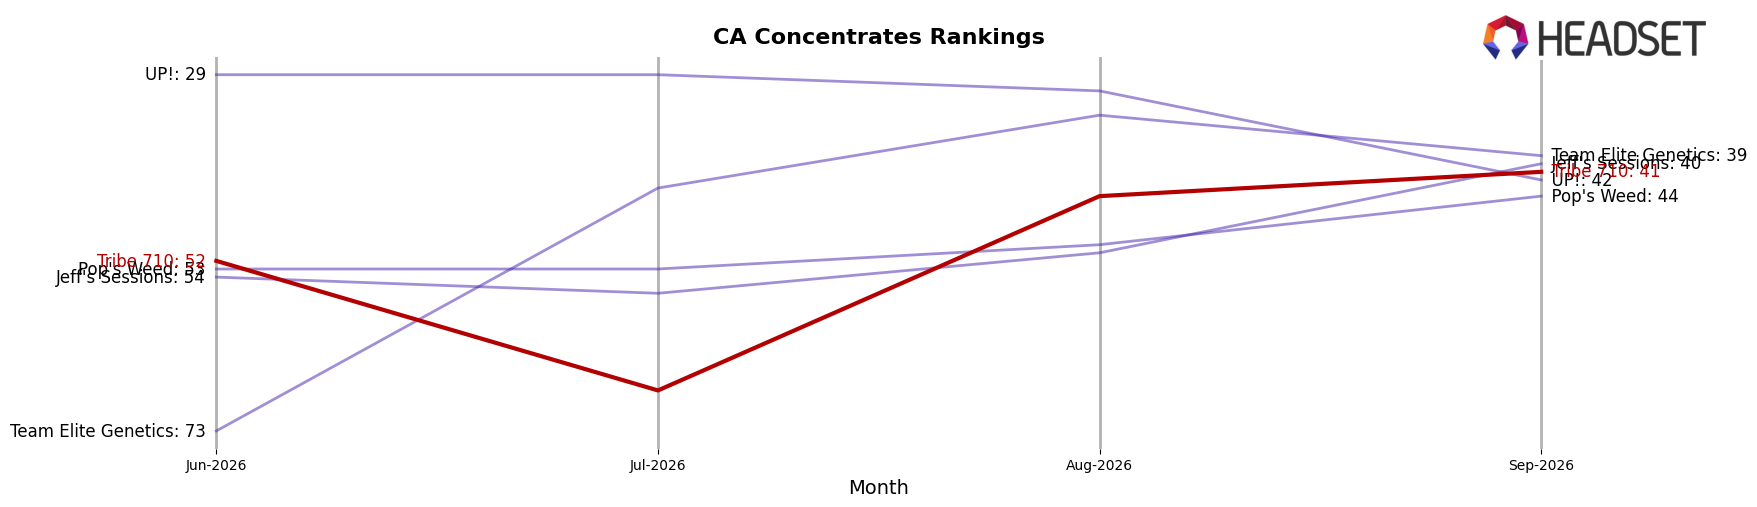
Tribe 710 sits at rank #41 in CA Concentrates in September 2026, improving 175 positions year over year from #216 while advancing 11 spots since June 2026 from #52, and this matches a new peak rank of #41 set in September 2026. Against category leaders, Raw Garden held #1 with a 9.4% year-over-year sales increase while Tribe 710’s rank rise outpaced that stability in positional change, and 710 Labs moved from #4 to #2 with 32.7% year-over-year sales growth, indicating Tribe 710’s trajectory relies more on rapid share capture from the mid-pack than on challenging the top three immediately. The pattern implies Tribe 710’s swift climb is driven by improved distribution or SKU relevance that converts into rank gains faster than category incumbents’ incremental growth, pointing to near-term potential to break into the top 30 if the 11-position gain over three months persists.
Notable Products
Melon Bread Batter (1g) delivered the standout move in September 2026 with a +127% month-over-month surge to $7,866 and a jump to rank 1, while Strawberry Rainbow Terp Sugar (1g) slid -24% to rank 3 and Sherb x Pie Scream Terp Sugar (1g) fell -14% to rank 4. Eight of the top ten SKUs are Concentrates across batter, sugar, diamonds, and sauce formats, and Blueberry Lemonade Batter (1g) inched up +8% to rank 7. The pattern implies Tribe 710 is consolidating around batter-led Concentrates where volatility can be used to rotate consumers toward higher-ranking SKUs.
Top Selling Cannabis Brands


Data for this report comes from real-time sales reporting by participating cannabis retailers via their point-of-sale systems, which are linked up with Headset’s business intelligence software. Headset’s data is very reliable, as it comes digitally direct from our partner retailers. However, the potential does exist for misreporting in the instance of duplicates, incorrectly classified products, inaccurate entry of products into point-of-sale systems, or even simple human error at the point of purchase. Thus, there is a slight margin of error to consider. Brands listed on this page are ranked in the top twenty within the market and product category by total retail sales volume.

