Jun-2026
Sales
Trend
6-Month
Product Count
SKUs
Avg Price
YoY Sales Change
YoY Price Change
Market Insights Snapshot
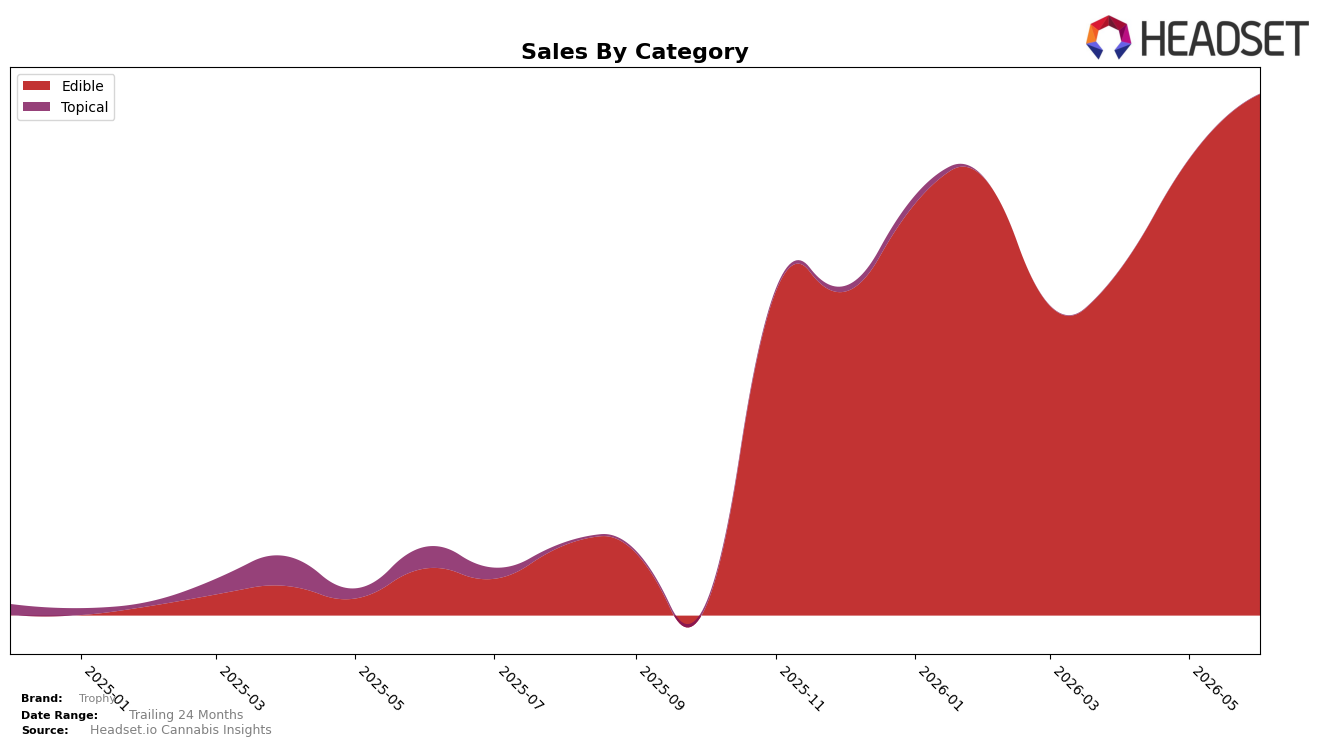
In June 2026, Trophy concentrated 100.0% of sales in Edible, with Edible up 1,016.01% year over year and 14.25% month over month, while average price rose 55.20% YoY to $25.68. Within the British Columbia Edible market, Trophy held rank 18 and posted overall brand sales growth of 667.26% YoY, implying the category-led expansion outpaced total brand momentum and is anchored in higher-priced units rather than breadth across categories.
The mix shift toward a single category alongside a 14.25% MoM gain and a rank of 18 in British Columbia indicates depth strategy over diversification, with pricing power (+55.20% YoY) supporting velocity despite concentration. This positioning suggests Trophy is trading up within Edible—benefiting from category-specific tailwinds of 1,016.01% YoY—while leaving share on the table in adjacent formats, and the gap between 667.26% brand growth and 1,016.01% category growth implies reliance on Edible leadership rather than cross-category insulation.
Competitive Landscape
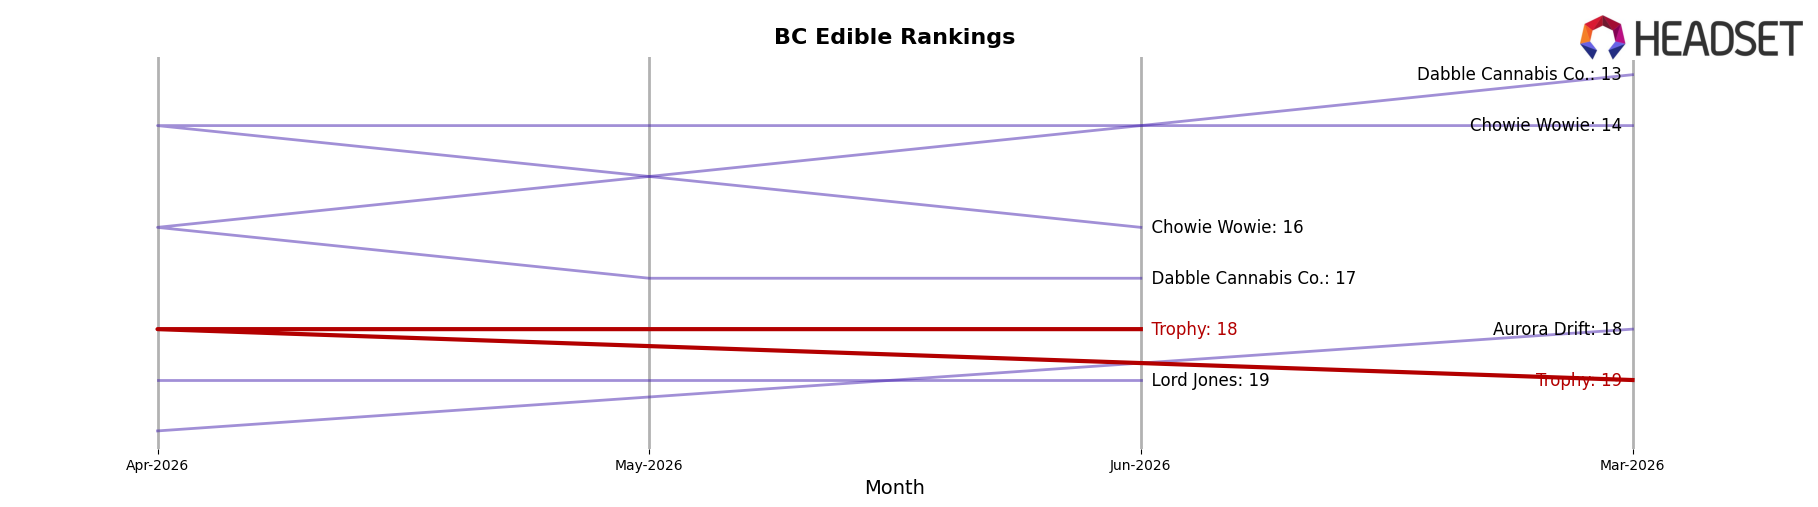
Trophy sits at rank #18 in BC Edible in June 2026, improving 16 positions from #34 year over year and edging up 1 spot from #19 in March 2026, while its best rank to date also lands at #18. Competitive context tightened at the top: Spinach moved from #2 to #1 with 39.8% YoY sales growth, No Future advanced from #3 to #2 with 94.0% YoY growth, and Gron / Grön slipped from #1 to #3 with an 11.0% YoY decline, while Wyld held #4 with 118.2% YoY growth—indicating the leaderboard is accelerating faster than mid-pack gains. The pattern—Trophy’s 16-rank YoY climb against top-tier competitors logging 39.8% to 118.2% YoY growth and rank moves of 1–2 places—implies Trophy’s trajectory is upward but will require either faster velocity or mix expansion to convert mid-teen rank into top-10 penetration.
Notable Products
CBD/CBG/CBN 1:1:1 Merry Berry Gummies 20-Pack (100mg CBD, 100mg CBG, 100mg CBN) fell 54.6% month over month and slid to rank 3, while CBD/CBN 1:1 Mixed Berry Creamsicle Gummies 20-Pack (100mg CBD, 100mg CBN) declined 22.1% at rank 2. In contrast, CBD Dragon Fruit Creamsicles Gummies 30-Pack (2100mg CBD) rose 25.4% MoM to hold rank 1, accounting for $26,694 in June 2026. With all top-three positions in Edible SKUs, the mix shows concentration in a single category even as two products contract by more than 20% and 50% respectively. The pattern implies Trophy is leaning on one flagship edible for volume while its diversified cannabinoid blends are losing momentum, signaling a need to rebalance innovation and support toward the hero SKU without letting the portfolio hollow out.
Top Selling Cannabis Brands
Data for this report comes from real-time sales reporting by participating cannabis retailers via their point-of-sale systems, which are linked up with Headset’s business intelligence software. Headset’s data is very reliable, as it comes digitally direct from our partner retailers. However, the potential does exist for misreporting in the instance of duplicates, incorrectly classified products, inaccurate entry of products into point-of-sale systems, or even simple human error at the point of purchase. Thus, there is a slight margin of error to consider. Brands listed on this page are ranked in the top twenty within the market and product category by total retail sales volume.

