Jun-2026
Sales
Trend
6-Month
Product Count
SKUs
Avg Price
YoY Sales Change
YoY Price Change
Market Insights Snapshot
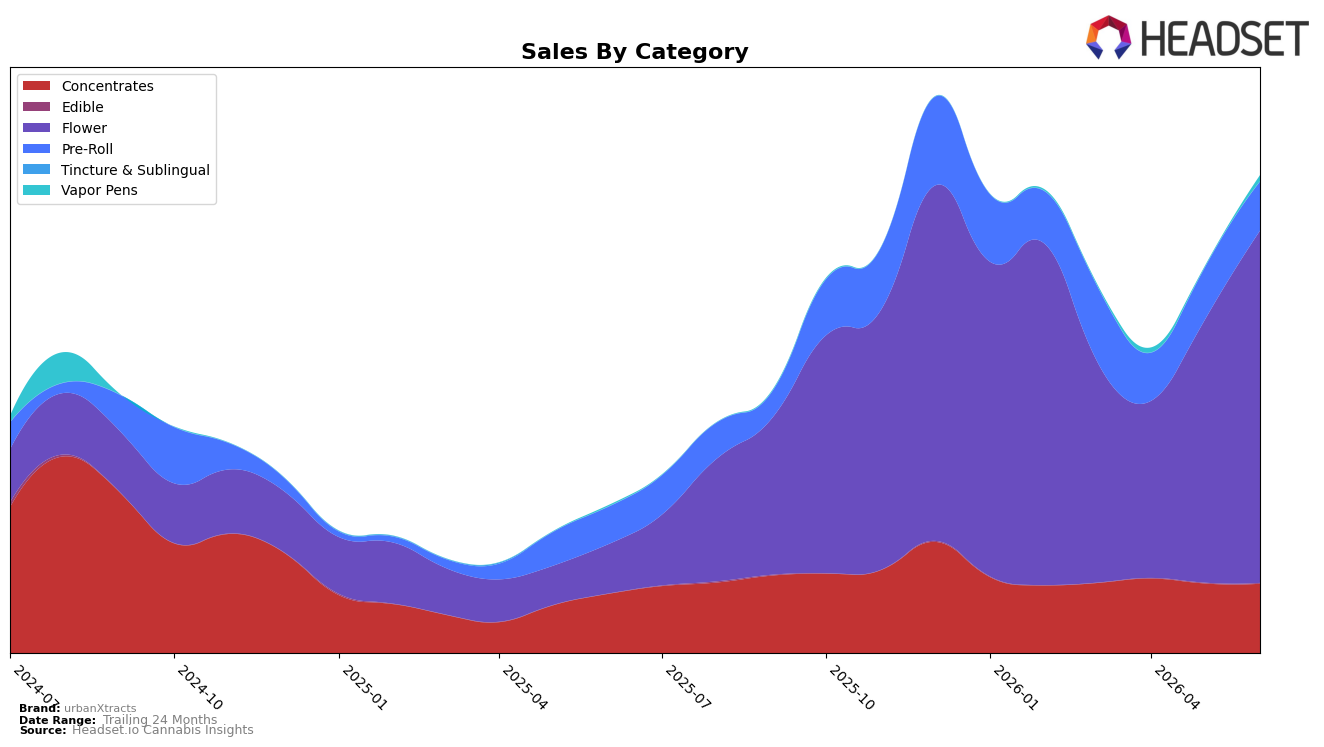
urbanXtracts concentrated 73.90% of June 2026 sales in Flower, up 34.22% month over month and 619.02% year over year, while Pre-Roll slipped to 10.24% share with a -6.14% MoM change but still rose 31.59% YoY. Concentrates held 14.54% share with a -0.42% MoM dip and 17.16% YoY growth, and Vapor Pens, though just 1.21% share, spiked 538.83% MoM and 475.19% YoY; Edible remained 0.11% share with 12.67% MoM growth and no YoY comp. With an average price of $43.36 and Flower’s premium average price at 72.15, the mix is tilting toward higher-ticket inhalables, implying a deliberate shift toward premiumized formats even as smaller formats like Pre-Roll moderate.
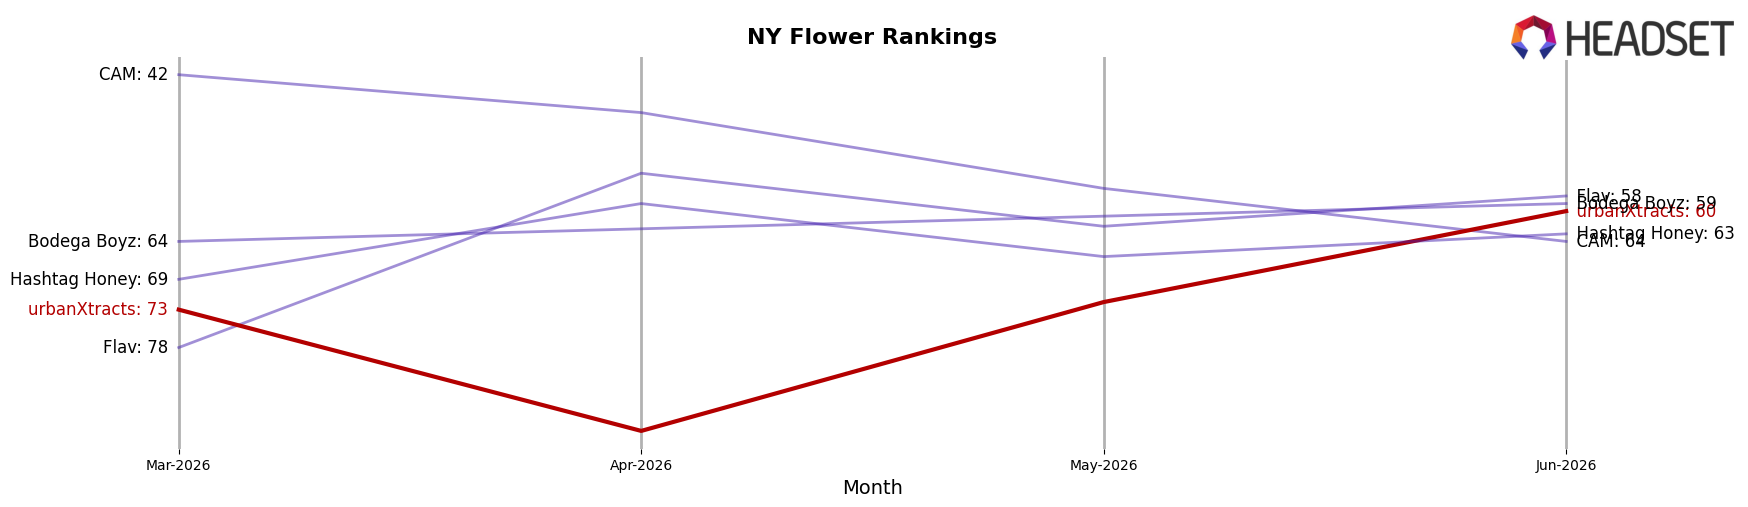
In New York Flower where urbanXtracts sits at rank 60, the 73.90% Flower concentration plus a 34.22% MoM surge suggests a push to climb entry-tier ranks through scale, while the 538.83% MoM jump in Vapor Pens at 1.21% share points to a test-and-expand posture rather than immediate share capture. The -6.14% MoM contraction in Pre-Roll alongside 17.16% YoY growth in Concentrates indicates resource reallocation away from lower-price, fast-turn formats toward higher-price inhalables, implying positioning that trades some breadth for depth in premium Flower and nascent Pens to improve rank efficiency over the next quarters.
Competitive Landscape
urbanXtracts sits at rank #60 in New York Flower in June 2026, improving 99 positions year over year from #159 and rising 13 spots since March 2026 from #73, while still trailing its peak of #54 reached in February 2026; by contrast, Find. advanced from #3 to #1 and RYTHM moved from #10 to #5 alongside a 40.6% year-over-year sales gain, indicating that competitors are consolidating share at the top as urbanXtracts climbs from the lower tiers. This mix of a triple-digit rank rebound year over year and a smaller three-month improvement implies momentum that could continue if the brand converts mid-pack volatility into sustained gains against faster-rising leaders.
Notable Products
Jet Fuel (14g) posted the standout move in June 2026 with a 137.6% month-over-month gain to rank 1, while Platinum Kush Breath Pre-Roll (1g) slipped 19.4% to rank 2. Four of the top ten are Pre-Roll SKUs, yet two of those declined by 11.4% and 6.6% at ranks 4 and 7, whereas Nana Glue Pre-Roll (1g) rose 17.1% at rank 5. Sweet Cheese (14g) added 11.9% at rank 3, but Nana Glue (3.5g) fell 39.7% at rank 9, indicating a bifurcation within Flower that concentrates demand in larger-size or specific strains. This mix suggests urbanXtracts is tilting toward higher-volume Flower formats while trimming underperforming smaller sizes, with Pre-Rolls serving as breadth rather than the growth engine.
Top Selling Cannabis Brands
Data for this report comes from real-time sales reporting by participating cannabis retailers via their point-of-sale systems, which are linked up with Headset’s business intelligence software. Headset’s data is very reliable, as it comes digitally direct from our partner retailers. However, the potential does exist for misreporting in the instance of duplicates, incorrectly classified products, inaccurate entry of products into point-of-sale systems, or even simple human error at the point of purchase. Thus, there is a slight margin of error to consider. Brands listed on this page are ranked in the top twenty within the market and product category by total retail sales volume.

