Jun-2026
Sales
Trend
6-Month
Product Count
SKUs
Avg Price
YoY Sales Change
YoY Price Change
Market Insights Snapshot
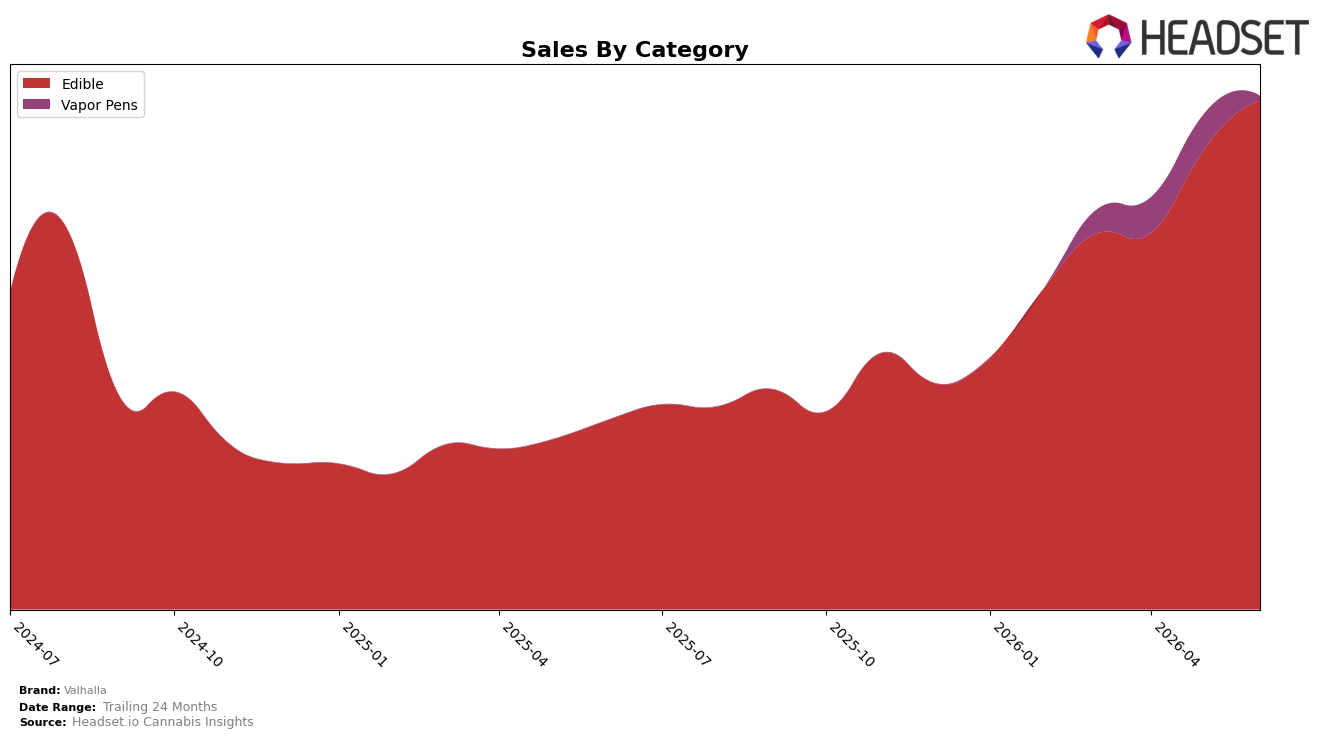
Valhalla concentrated 99.01% of June 2026 sales in Edible, up 10.36% month over month and 168.57% year over year, while Vapor Pens fell 85.75% MoM to 0.99% share with no year-over-year baseline, indicating a near-single-category footprint. Despite brand-level sales up 171.25% YoY and average price down 19.38% YoY, the Edible-led mix produced a rank of 10 in Edible within New Jersey, implying that growth is driven by volume expansion at reduced price points rather than diversification.
The pivot toward Edible at 99.01% share alongside a 10-place threshold ranking (rank 10) suggests a scale play where June 2026 gains come from deepening penetration in one aisle rather than cross-category breadth, and the 85.75% MoM contraction in Vapor Pens reduces optionality just as average prices decline 19.38% YoY. With category growth at 168.57% in Edible nearly matching the brand’s 171.25% YoY, the strategy ties Valhalla’s trajectory to Edible market cycles, implying that positioning is anchored on price-advantaged volume in Edible and will remain sensitive to any June-to-July mix shifts given the sub-1% share in Vapor Pens.
Competitive Landscape
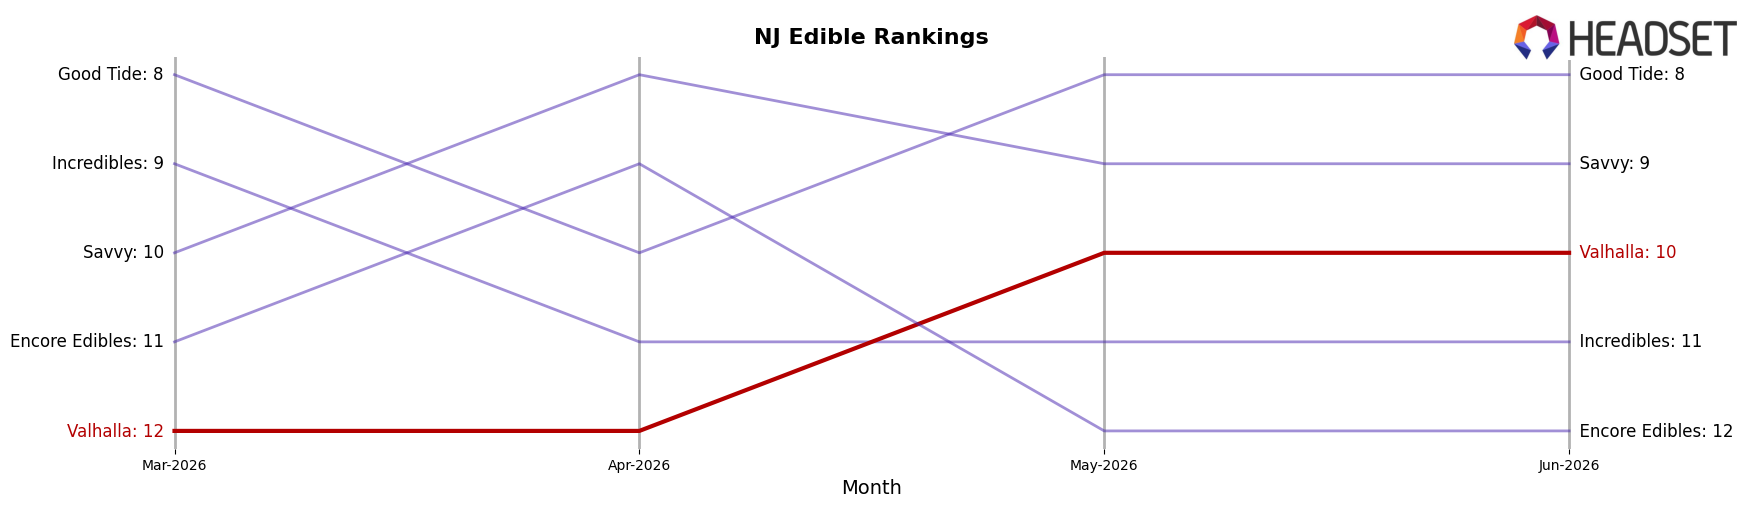
Valhalla ranks #10 in NJ Edible in June 2026, improving 8 positions year over year from #18, and rising 2 spots since March 2026 from #12, while also matching its peak rank at #10 in June 2026. In contrast, Wyld advanced from #4 to #2 with a 28% YoY sales increase and Select slid from #2 to #3 with a 26% YoY sales decline, indicating that Valhalla’s climb happened amid mixed competitor momentum. With category leaders like Gron / Grön holding #1 year over year despite a 22% YoY sales contraction and OGEEZ moving from #9 to #5 on 45% YoY sales growth, Valhalla’s move from #18 to #10 implies it is gaining share position in a shifting top tier rather than relying on broad market expansion, a trajectory that suggests continued rank pressure to crack the top 8.
Notable Products
Strawberry Lemonade Soft Lozenges 10-Pack (100mg) posted a 117% month-over-month surge to approximately $90,594 and rose to rank 1, marking the clearest upside inflection in June 2026 while Sour Watermelon Soft Lozenges 10-Pack (100mg) slipped 8% and held rank 6. Indica Blue Raspberry Soft Lozenges 10-Pack (100mg) in rank 2 gained 5% month over month, whereas Green Apple Soft Lozenges 10-Pack (100mg) in rank 3 dipped 2% month over month, indicating demand clustering at the top that favors one breakout flavor over incremental movers. Eight of the top ten are Edible soft lozenges or gummies, concentrating share in a single dosage format while new 2-Pack entries sit lower at ranks 8–10 with flat-to-negative momentum and no reported month-over-month lift. The pattern implies Valhalla is consolidating around high-velocity lozenge SKUs, using flavor-led spikes to anchor the portfolio while RSO and 2-Pack extensions play a secondary role in June 2026.
Top Selling Cannabis Brands
Data for this report comes from real-time sales reporting by participating cannabis retailers via their point-of-sale systems, which are linked up with Headset’s business intelligence software. Headset’s data is very reliable, as it comes digitally direct from our partner retailers. However, the potential does exist for misreporting in the instance of duplicates, incorrectly classified products, inaccurate entry of products into point-of-sale systems, or even simple human error at the point of purchase. Thus, there is a slight margin of error to consider. Brands listed on this page are ranked in the top twenty within the market and product category by total retail sales volume.

