Jun-2026
Sales
Trend
6-Month
Product Count
SKUs
Avg Price
YoY Sales Change
YoY Price Change
Market Insights Snapshot
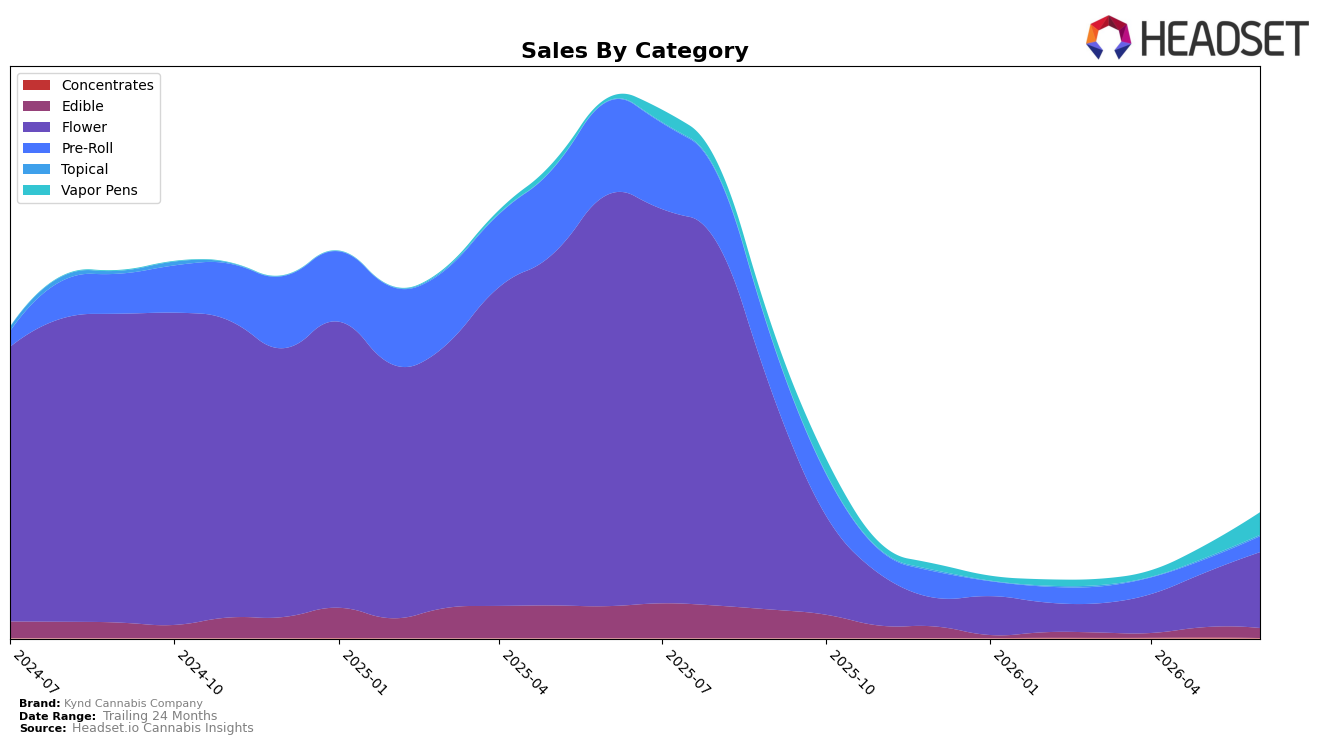
Kynd Cannabis Company concentrated 60.90% of June 2026 sales in Flower while Vapor Pens expanded to 18.01% share, and Pre-Roll and Edible accounted for 12.52% and 7.77% respectively; this mix coincided with a -76.99% brand sales year over year and an 8.88% average price increase. Within categories, Flower fell -81.66% year over year but gained 39.92% month over month, Vapor Pens surged 713.78% year over year and 82.73% month over month, while Pre-Roll declined -83.28% year over year but rose 18.99% month over month; the pattern indicates a pivot from legacy Flower and Pre-Roll toward inhalables with faster unit velocity despite price sensitivity.
Positioning-wise, the brand’s Flower ranking at #30 in Ohio combined with a -69.54% Edible year-over-year change and a -3.56% month-over-month dip suggests diminished pull in non-inhalable formats, while Topical’s 358.83% year-over-year change off a 0.73% share base and Concentrates’ -84.76% month-over-month contraction at 0.07% share show narrow, volatile niches. With Vapor Pens comping up triple-digits and Flower still carrying a majority share, the implication is that near-term share defense depends on stabilizing Flower price-pack architecture while scaling Vapor Pens to rebalance mix risk and reduce exposure to steep Flower and Pre-Roll year-over-year declines.
Competitive Landscape
Kynd Cannabis Company is ranked #30 in June 2026, down 6 positions year over year from #24, but up 16 positions from March 2026’s #46, while still trailing its peak of #22 from April 2025; meanwhile, Klutch Cannabis climbed from #20 to #1 with 304.8% year-over-year sales growth and RYTHM moved from #6 to #3 with 67.7% growth, contrasting with Riviera Creek slipping on sales by 22.7% while holding #2. This combination of a 6-place annual decline and a 16-place rebound in the last quarter implies Kynd Cannabis Company is recovering share tactically but is being outpaced by faster-rising leaders, pointing to a need to convert recent momentum into sustained gains against brands moving up the leaderboard.

Notable Products
Caesar (2.83g) posted the steepest decline in June 2026 at -19.9% MoM while sliding to rank 4, contrasted by CBD/THC 1:1 Hybrid Black Cherry Gummies 20-Pack (100mg CBD, 100mg THC) jumping 51.3% MoM to rank 5. Lollipopz (3.5g) rose 41.0% MoM at rank 3 while Indica Relax Sour Blue Raspberry Gummies 10-Pack (100mg) climbed 45.2% MoM at rank 6, and Nitro Boost Pre-Roll (1g) fell -16.1% at rank 7. Three of the top ten are Pre-Roll SKUs occupying ranks 1, 2, and 9 alongside a decline at rank 7, while two Edibles now sit in the top six, indicating a rebalancing toward ingestibles as value Flower like Caesar loses momentum.
Top Selling Cannabis Brands
Data for this report comes from real-time sales reporting by participating cannabis retailers via their point-of-sale systems, which are linked up with Headset’s business intelligence software. Headset’s data is very reliable, as it comes digitally direct from our partner retailers. However, the potential does exist for misreporting in the instance of duplicates, incorrectly classified products, inaccurate entry of products into point-of-sale systems, or even simple human error at the point of purchase. Thus, there is a slight margin of error to consider. Brands listed on this page are ranked in the top twenty within the market and product category by total retail sales volume.

