.svg)

Sep-2026
Sales
Trend
6-Month
Product Count
SKUs
Avg Price
YoY Sales Change
YoY Price Change


Where to Buy
Vapen is stocked at 46 licensed dispensaries across Ohio, Arizona, and Oklahoma, 33 of them in Ohio, with the deepest coverage in Columbus, Cincinnati, Cleveland, Lorain, and Athens. Search by ZIP code or city below to find the closest one, or filter by product type if you are after a specific format.
Market Insights Snapshot
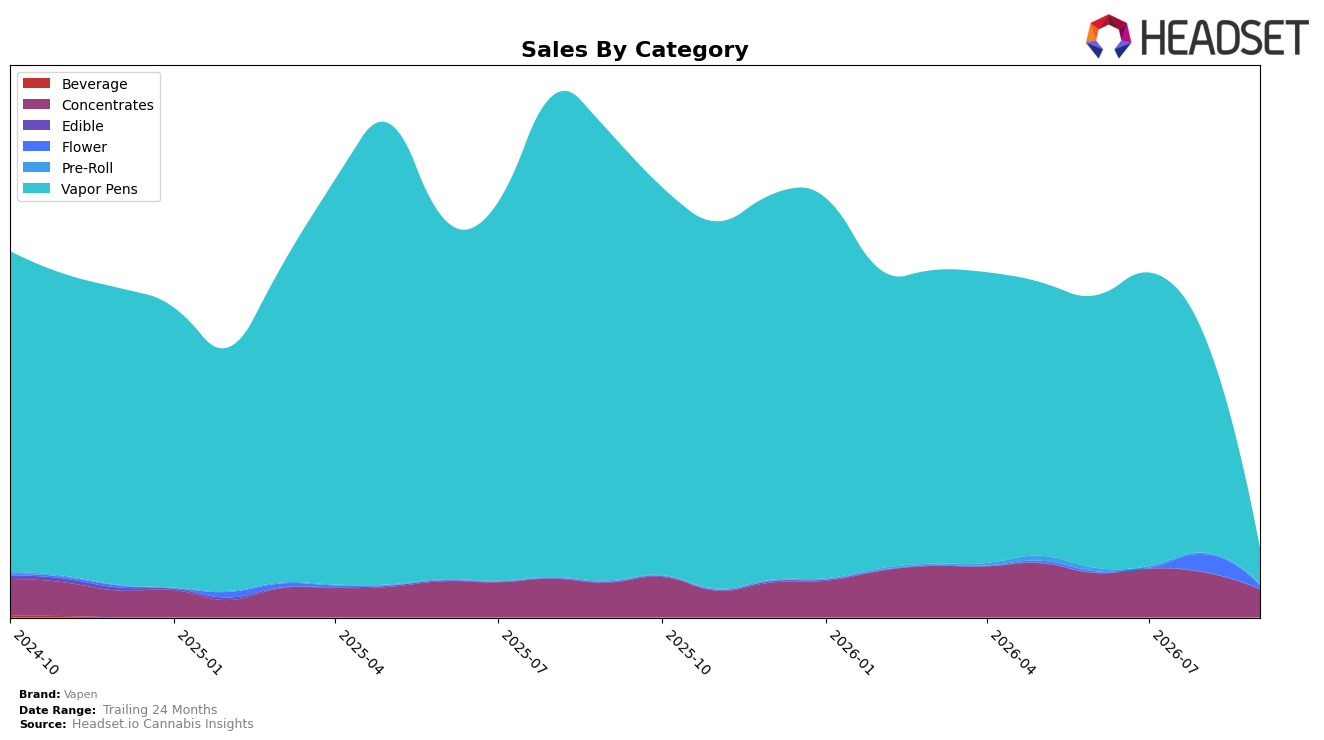
Vapen’s category mix in September 2026 skewed toward Vapor Pens at 53.84% share, but that pillar contracted sharply with a 91.96% year-over-year decline and an 83.27% month-over-month drop, while Concentrates held 40.87% share with a 19.86% YoY slide and a 37.97% MoM decrease. Flower expanded 2,383.63% YoY yet still sat at only 4.63% share after an 82.20% MoM fall, and Pre-Roll was 0.67% share with a 9.63% YoY decline and a 57.96% MoM pullback. With average price down 7.92% YoY to $20.68 and Vapor Pens retreating faster than Concentrates, the mix implies a compression toward fewer, lower-priced pen units and a narrowing reliance on Concentrates to stabilize revenue volatility.
The shifts reposition Vapen toward a smaller, higher-price-point core in Concentrates relative to Vapor Pens, as Concentrates carry a higher average price of $25.62 versus $17.39 for pens, while Ohio rank 18 in Concentrates places the brand mid-pack rather than a category leader. The steep 83.27% MoM contraction in Vapor Pens alongside a milder 37.97% MoM decline in Concentrates indicates short-term allocation should favor Concentrates where rank 18 offers headroom, while the 2,383.63% YoY surge in Flower with only 4.63% share signals experimental penetration that has not translated into sustained volume after an 82.20% MoM drop. Taken together, the pattern implies Vapen’s near-term positioning rests on defending Concentrates share and price integrity while treating pens as a downsizing risk center and Flower as a low-base option for selective, controlled expansion.
Competitive Landscape
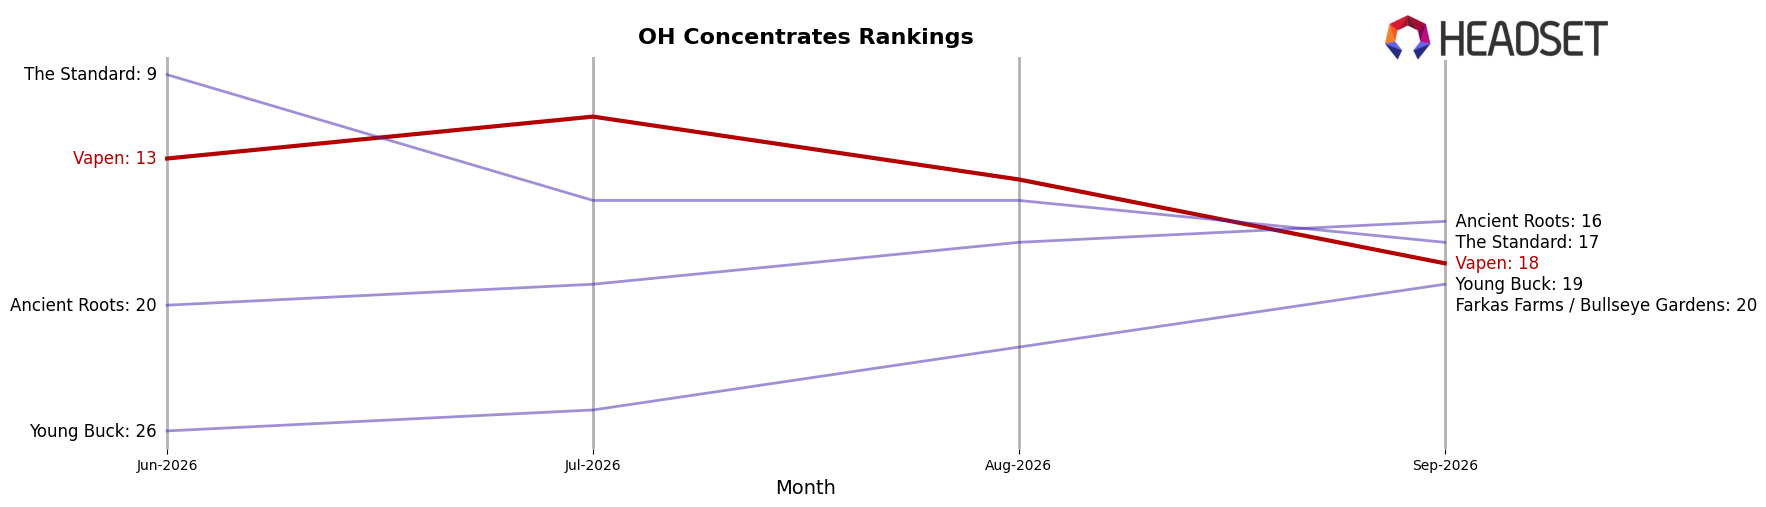
Vapen ranks #18 in OH Concentrates in September 2026, down 5 positions year over year from #13, after slipping 5 spots since June 2026 when it sat at #13 and retreating from a peak of #11 in July 2026; meanwhile, Klutch Cannabis held at #1 both year over year and in September 2026 while growing sales by 96.3%, and Hundred Percent Labs rose from #4 to #3 with 119.7% YoY sales growth, indicating Vapen’s downward rank shift is tied to faster-moving rivals rather than a one-off monthly fluctuation, and implying that without a share recapture strategy the trajectory points to further mid-tier erosion.
Notable Products
Passion Fruit Punch Distillate Cartridge (1g) posted the steepest decline at -87.7% month over month while holding rank 6, and Maui Wowie Distillate Cartridge (1g) fell -70.7% at rank 2, indicating a rapid pullback concentrated in flavored distillate SKUs. Granddaddy Purple Distillate Cartridge (1g) also contracted -61.5% yet stayed at rank 1, while at least seven of the top ten are Vapor Pens, concentrating category exposure even as month-over-month volatility exceeds -60% for multiple leaders. With Vapor Pens dominating ranks 1 through 9 and only one Concentrates SKU in the top ten, the mix signals over-reliance on a single form factor and suggests Vapen is prioritizing breadth within distillate cartridges over diversification, a direction that risks further swings unless additional categories offset pen-driven variability.
Top Selling Cannabis Brands






Data for this report comes from real-time sales reporting by participating cannabis retailers via their point-of-sale systems, which are linked up with Headset’s business intelligence software. Headset’s data is very reliable, as it comes digitally direct from our partner retailers. However, the potential does exist for misreporting in the instance of duplicates, incorrectly classified products, inaccurate entry of products into point-of-sale systems, or even simple human error at the point of purchase. Thus, there is a slight margin of error to consider. Brands listed on this page are ranked in the top twenty within the market and product category by total retail sales volume.

