Jun-2026
Sales
Trend
6-Month
Product Count
SKUs
Avg Price
YoY Sales Change
YoY Price Change
Market Insights Snapshot
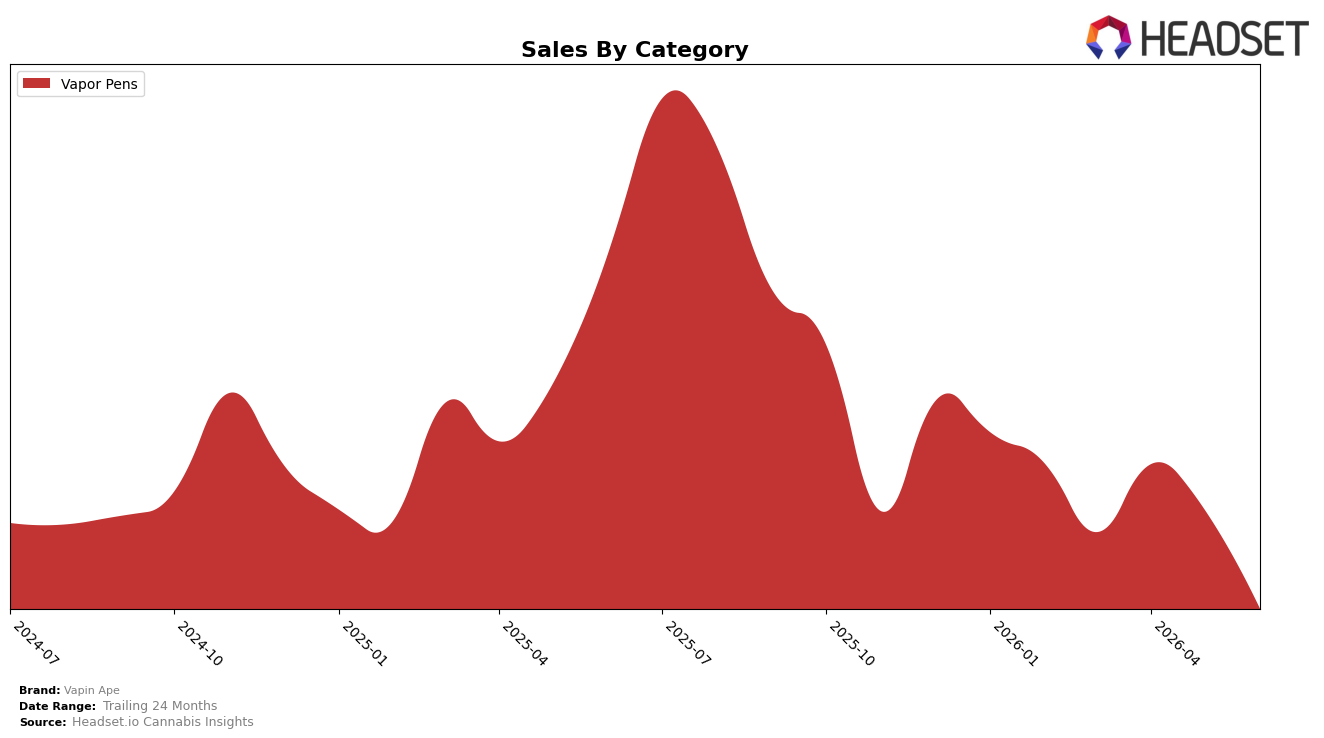
In June 2026, Vapin Ape’s category mix was concentrated entirely in Vapor Pens at 100.0% share, with year-over-year sales down 34.2% and month-over-month down 12.6%, while the average price rose 11.4% YoY to $27.28; this combination points to volume contraction outpacing any pricing lift. Within Michigan Vapor Pens, the brand sat at rank 22, and the all-category sales trend over 24 months declined 22.4%, indicating that recent June headwinds were sharper than the longer-run baseline; the pattern implies that June’s softness is not just seasonal drift but a deeper share and velocity issue within a single-category footprint.
The single-category dependence, paired with a 34.2% YoY sales drop against an 11.4% YoY price increase and a rank of 22 in Michigan Vapor Pens, implies that Vapin Ape is positioned as a mid-pack player whose pricing is not converting to sustained units. With 100.0% of sales in Vapor Pens and a 12.6% MoM slide in June 2026 versus a milder 24-month decline of 22.4%, the brand’s exposure to category-specific volatility is elevated; this suggests near-term positioning should pivot toward unit recapture within Vapor Pens rather than price-led growth, as elasticity is currently working against the brand.
Competitive Landscape
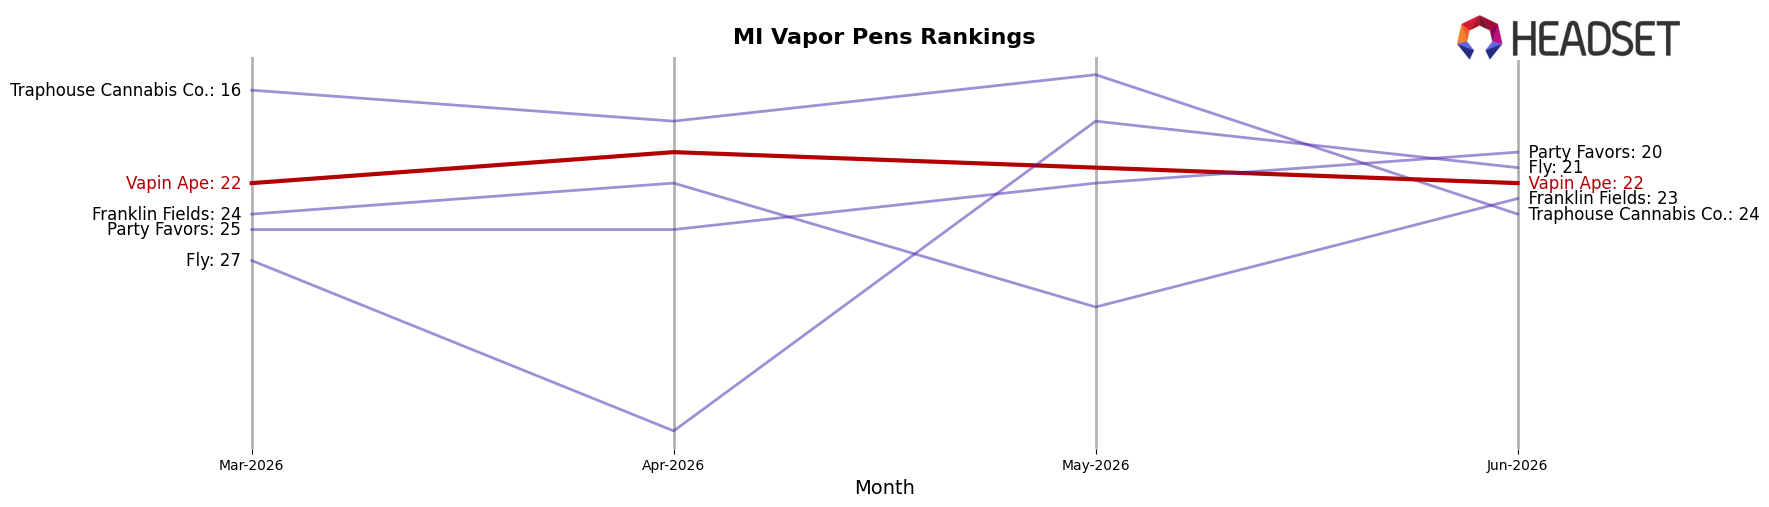
Vapin Ape sits at rank #22 in June 2026 in MI Vapor Pens, down 11 positions year over year, and flat versus March 2026 at #22 while still 13 spots below its peak of #9 from July 2025; meanwhile, MKX Oil Company climbed to #1 from #3 with a 68.3% YoY sales lift, and Society C surged to #4 from #29 with a 756.2% YoY increase, indicating Vapin Ape’s relative share is being compressed as faster movers advance up the ranks, implying that without a catalyst to reverse the 11-rank YoY slide, the brand risks entrenchment in the low-20s tier.
Notable Products
Pineapple Haze HTE Distillate Disposable (2g) led June 2026 with rank 1 but fell 16.5% month over month while Grape Runtz HTE Distillate Disposable (2g) slid 27.3% to rank 3, and Animal Mints HTE Distillate Disposable (1g) declined 30.9% at rank 4. Black Cherry Kush Full Spectrum Distillate Disposable (2g) was the lone riser in the top tier, up 9.2% at rank 2, while four of the top ten are HTE Distillate Disposables, signaling a concentration in HTE formats even as several 1g variants dropped more than 10%. With nine of the top ten in Vapor Pens and only one SKU showing positive MoM, the mix implies reliance on a narrow disposable pen portfolio that is sensitive to flavor rotation and size preferences, suggesting near-term emphasis should shift toward stabilizing HTE leaders while reassessing underperforming 1g lines.
Top Selling Cannabis Brands
Data for this report comes from real-time sales reporting by participating cannabis retailers via their point-of-sale systems, which are linked up with Headset’s business intelligence software. Headset’s data is very reliable, as it comes digitally direct from our partner retailers. However, the potential does exist for misreporting in the instance of duplicates, incorrectly classified products, inaccurate entry of products into point-of-sale systems, or even simple human error at the point of purchase. Thus, there is a slight margin of error to consider. Brands listed on this page are ranked in the top twenty within the market and product category by total retail sales volume.

