Apr-2026
Sales
Trend
6-Month
Product Count
SKUs
Avg Price
YoY Sales Change
YoY Price Change
Market Insights Snapshot
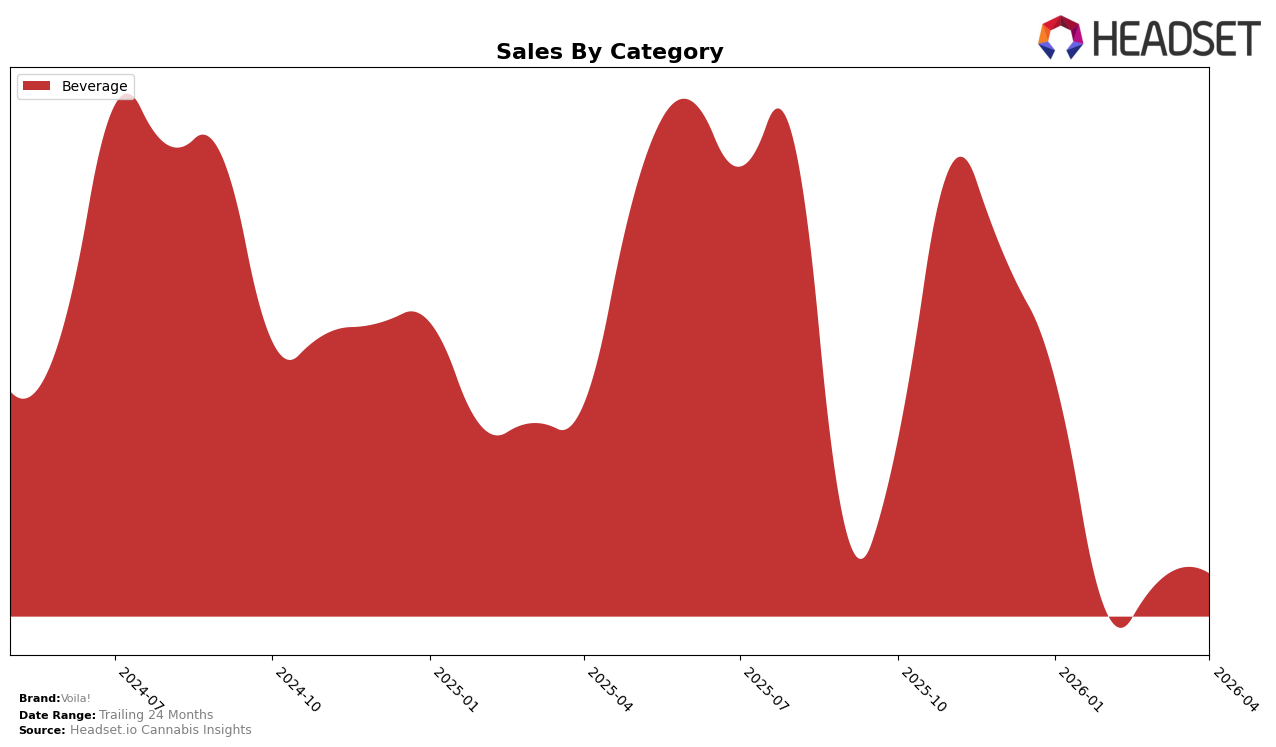
Voila! has shown a promising start in the California beverage market, securing the 20th position in January 2026. However, the absence of rankings in February, March, and April suggests that the brand did not maintain its presence in the top 30 in subsequent months. This decline in ranking could indicate increased competition or challenges in maintaining market share within the beverage category. Despite this, the initial entry into the top 20 highlights Voila!'s potential to capture consumer interest, which could be leveraged for strategic growth in the future.
The performance of Voila! across other states and categories remains to be seen, as the data available only highlights their activity in California. The brand's initial success in the beverage category might suggest a niche strength that could be explored further in other regions. However, the lack of data from other states or provinces implies that Voila! might not yet have a significant footprint beyond California, or it could be that they are focusing efforts on establishing a stronger presence in one market before expanding. This strategic approach could be beneficial as they continue to develop their brand identity and consumer base.
Competitive Landscape
In the competitive landscape of the California beverage category, Voila! has shown a promising entry by securing the 20th rank in January 2026. However, it did not maintain a position in the top 20 in subsequent months, indicating a potential challenge in sustaining its market presence. In contrast, Kan+Ade consistently ranked 15th from January to March 2026, before dropping to 17th in April, suggesting a slight decline in its market hold. Meanwhile, Cannalean emerged in March with a 16th rank, potentially capturing market share that could have impacted Voila!'s standing. The data suggests that while Voila! had a notable entry, maintaining and improving its rank amidst competitors like Sip Elixirs and 5G (530 Grower) will be crucial for its growth in the California beverage market.

Notable Products
In April 2026, the top-performing product for Voila! was the CBD/THC 1:2 Cucumber Mint Sparking Water, which reclaimed its number one rank with sales of 226 units, marking a significant increase from March. The CBD/THC 1:2 Pineapple Strawberry Sparking Water, previously leading in March, ranked second in April with a slight decrease in sales. The CBD/THC 1:2 Peach Pear Sparking Water maintained its third position from March to April, indicating consistent performance. Notably, the CBD/THC 1:1 Pineapple Strawberry Sparkling Water was not ranked in April, suggesting a possible drop in popularity or sales discontinuation. Overall, the Beverage category saw a reshuffling in the top ranks, with Cucumber Mint and Pineapple Strawberry consistently competing for the top spots.
Top Selling Cannabis Brands
Data for this report comes from real-time sales reporting by participating cannabis retailers via their point-of-sale systems, which are linked up with Headset’s business intelligence software. Headset’s data is very reliable, as it comes digitally direct from our partner retailers. However, the potential does exist for misreporting in the instance of duplicates, incorrectly classified products, inaccurate entry of products into point-of-sale systems, or even simple human error at the point of purchase. Thus, there is a slight margin of error to consider. Brands listed on this page are ranked in the top twenty within the market and product category by total retail sales volume.

