Jun-2026
Sales
Trend
6-Month
Product Count
SKUs
Avg Price
YoY Sales Change
YoY Price Change
Market Insights Snapshot
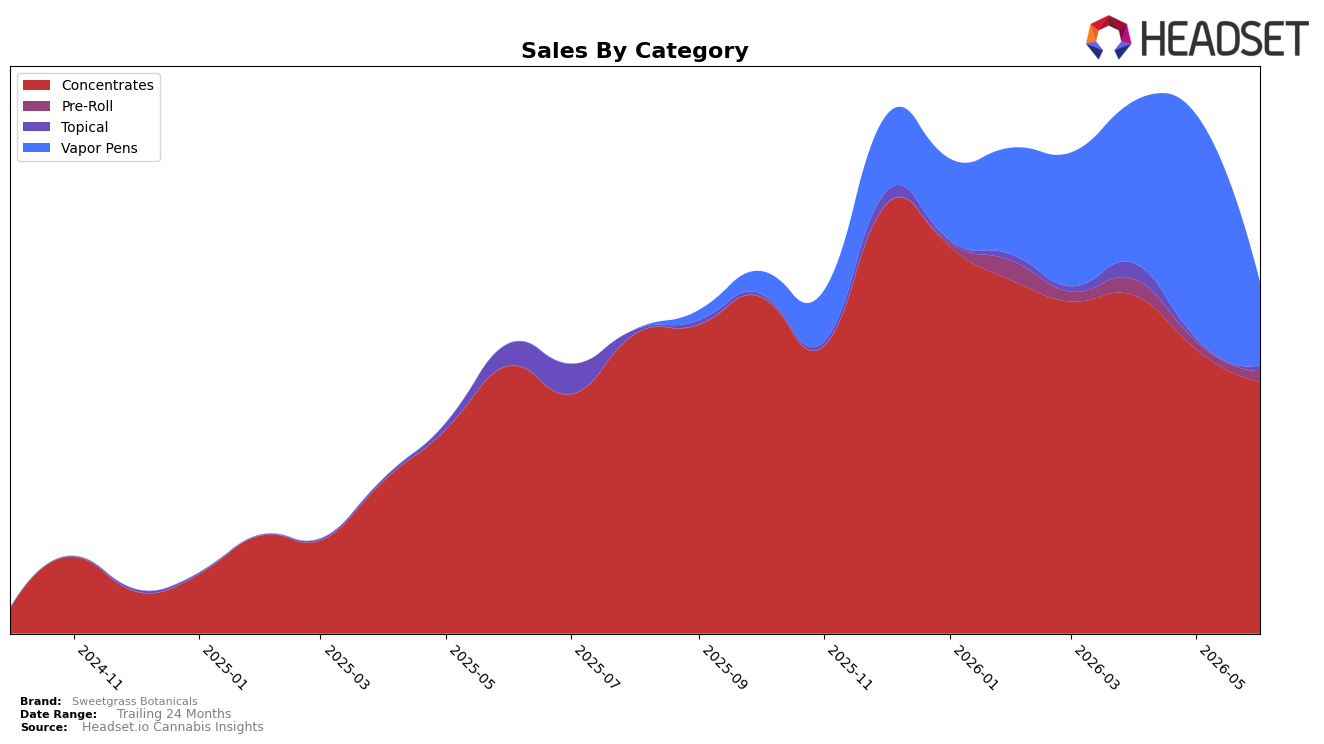
Sweetgrass Botanicals concentrated its June 2026 mix in Concentrates at 71.9% share while the segment declined 5.8% year over year and 11.3% month over month; Vapor Pens held 23.7% share but fell 62.9% month over month, and Topical rose 111.1% month over month despite a 75.6% year-over-year drop. Pre-Roll expanded 31.9% month over month to 2.9% share, while the brand’s average price declined 12.7% year over year to $42.22, coinciding with overall brand sales rising 21.1% year over year. The pattern implies Sweetgrass Botanicals is leaning on price elasticity and a Concentrates-heavy portfolio to lift total sales despite month-over-month pressure in its two largest categories, with volatility suggesting near-term mix instability.
With Concentrates still anchoring the brand but slipping 11.3% month over month and the brand ranked 20 in Concentrates in Massachusetts, the mix shift indicates a need to defend shelf position through price-pack architecture rather than volume alone. The sharp 62.9% month-over-month contraction in Vapor Pens alongside a 31.9% Pre-Roll lift and a 111.1% Topical rebound points to substitution toward lower-priced or niche formats, implying Sweetgrass Botanicals can stabilize rank by reallocating promotional depth from Vapor Pens into Pre-Roll and targeted Topical SKUs while using the 12.7% year-over-year price decrease to protect share in Concentrates.
Competitive Landscape
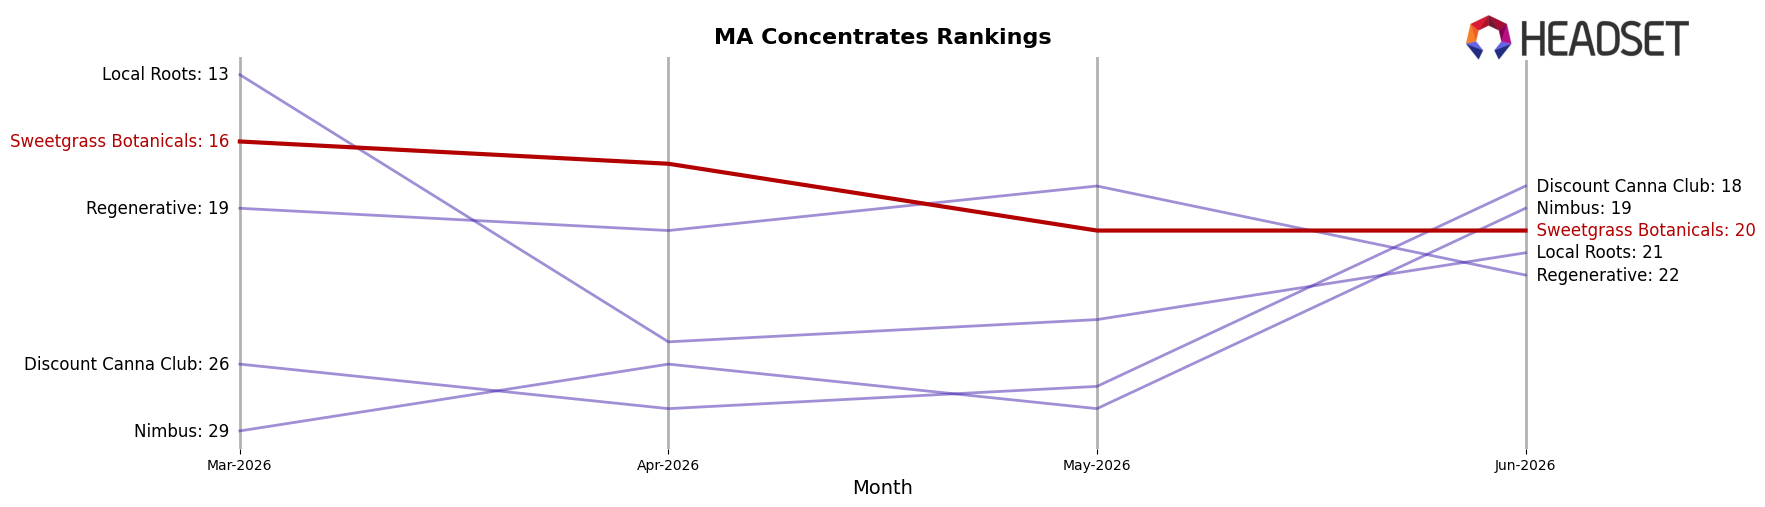
Sweetgrass Botanicals sits at #20 in June 2026 in MA Concentrates, a 1-place improvement from #21 year over year but a 4-place drop from #16 in March 2026, with distance from its peak of #11 in December 2025 indicating mid-pack slippage; meanwhile, Good Chemistry Nurseries holds #1 with a 31.3% YoY sales increase and Crispy Commission Concentrates remains #2 despite a 23.7% YoY decline, showing that Sweetgrass Botanicals’ slight YoY rank gain alongside a recent quarter-on-quarter slide implies stabilization without momentum against leaders widening or defending top positions.
Notable Products
Lemon Cake Live Rosin (1g) posted the standout movement with a +79% month-over-month surge to rank 1, while Vapor Pens like Papaya Live Rosin Cartridge (0.5g) fell -69% at rank 5 and Alien Marker Live Rosin Cartridge (0.5g) slid -55% at rank 8. Concentrates occupy six of the top ten, led by ranks 1, 2, 4, 6, 6, and 7, whereas Vapor Pens hold ranks 3, 5, 8, and 9 with steep declines of -47%, -69%, -55%, and -43%. With the category mix tilting toward Concentrates leadership and Vapor Pens retrenching, the pattern implies Sweetgrass Botanicals is consolidating demand around solventless formats and may prioritize rosin innovation over pen SKUs in July 2026.
Top Selling Cannabis Brands
Data for this report comes from real-time sales reporting by participating cannabis retailers via their point-of-sale systems, which are linked up with Headset’s business intelligence software. Headset’s data is very reliable, as it comes digitally direct from our partner retailers. However, the potential does exist for misreporting in the instance of duplicates, incorrectly classified products, inaccurate entry of products into point-of-sale systems, or even simple human error at the point of purchase. Thus, there is a slight margin of error to consider. Brands listed on this page are ranked in the top twenty within the market and product category by total retail sales volume.

