Sep-2025
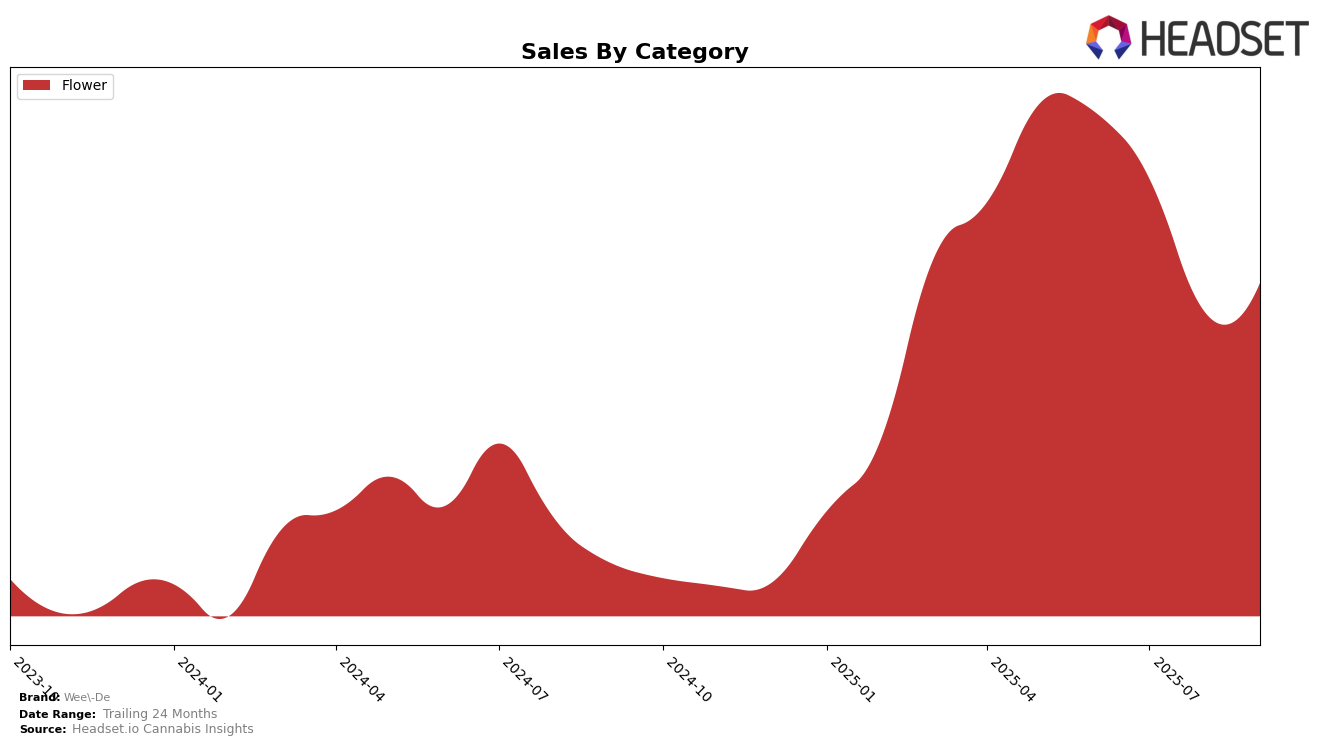
Sales
Trend
6-Month
Product Count
SKUs
Avg Price
YoY Sales Change
YoY Price Change
Market Insights Snapshot
In the Massachusetts market, Wee-De's performance in the Flower category has shown some fluctuations over the past few months. Starting from a rank of 15 in June 2025, the brand saw a decline to 28 by August, before recovering slightly to 25 by September. This movement indicates a competitive landscape where maintaining a strong position requires consistent performance. The drop in rankings during the summer months could be attributed to various factors, including market dynamics or consumer preferences shifting temporarily. Despite the challenges, Wee-De's ability to climb back in September suggests a potential strategy adjustment or market response that warrants further observation.
While Wee-De maintained a presence within the top 30 brands in the Flower category in Massachusetts, the lack of rankings in other states or categories during this period highlights areas for potential growth or concern. Not appearing in the top 30 in other states could indicate either a strategic focus on specific markets or challenges in expanding their footprint. This absence suggests that while they have a foothold in Massachusetts, there may be untapped opportunities or competitive pressures in other regions. Understanding the nuances of these movements can provide valuable insights into the brand's overall strategy and market positioning.
Competitive Landscape
In the competitive landscape of the flower category in Massachusetts, Wee-De has experienced notable fluctuations in its ranking and sales over the past few months. Starting from a strong position at rank 15 in June 2025, Wee-De saw a decline to rank 28 by August, before slightly recovering to rank 25 in September. This downward trend in rank is mirrored by a decrease in sales from June to August, although there was a modest recovery in September. In contrast, competitors such as Sparq Cannabis Company have shown a more consistent upward trajectory, improving their rank from 30 in June to 24 in September, accompanied by a steady increase in sales. Similarly, Springtime has maintained a relatively stable rank, hovering around the low 20s, with a noticeable increase in sales. The competitive pressure from these brands, alongside others like INSA, which maintained a consistent presence in the top 30, suggests that Wee-De may need to reassess its strategies to regain its earlier momentum and improve its standing in the Massachusetts flower market.

Notable Products
In September 2025, Don Mega (7g) retained its position as the top-performing product for Wee-De, achieving a significant sales figure of 3550 units. Devi 11 #1 (7g) made a strong return to the rankings, securing the second spot, despite having no data for July and August. Guava Tart (7g) emerged as a new contender, entering the rankings at third place with sales of 1155 units. Layer Cake (7g) dropped slightly to fourth place, maintaining a consistent presence in the top five over the past months. Peach Ringz (7g) appeared on the list for the first time, taking the fifth spot in September.
Top Selling Cannabis Brands
Data for this report comes from real-time sales reporting by participating cannabis retailers via their point-of-sale systems, which are linked up with Headset’s business intelligence software. Headset’s data is very reliable, as it comes digitally direct from our partner retailers. However, the potential does exist for misreporting in the instance of duplicates, incorrectly classified products, inaccurate entry of products into point-of-sale systems, or even simple human error at the point of purchase. Thus, there is a slight margin of error to consider. Brands listed on this page are ranked in the top twenty within the market and product category by total retail sales volume.

