May-2026
Sales
Trend
6-Month
Product Count
SKUs
Avg Price
YoY Sales Change
YoY Price Change
Market Insights Snapshot
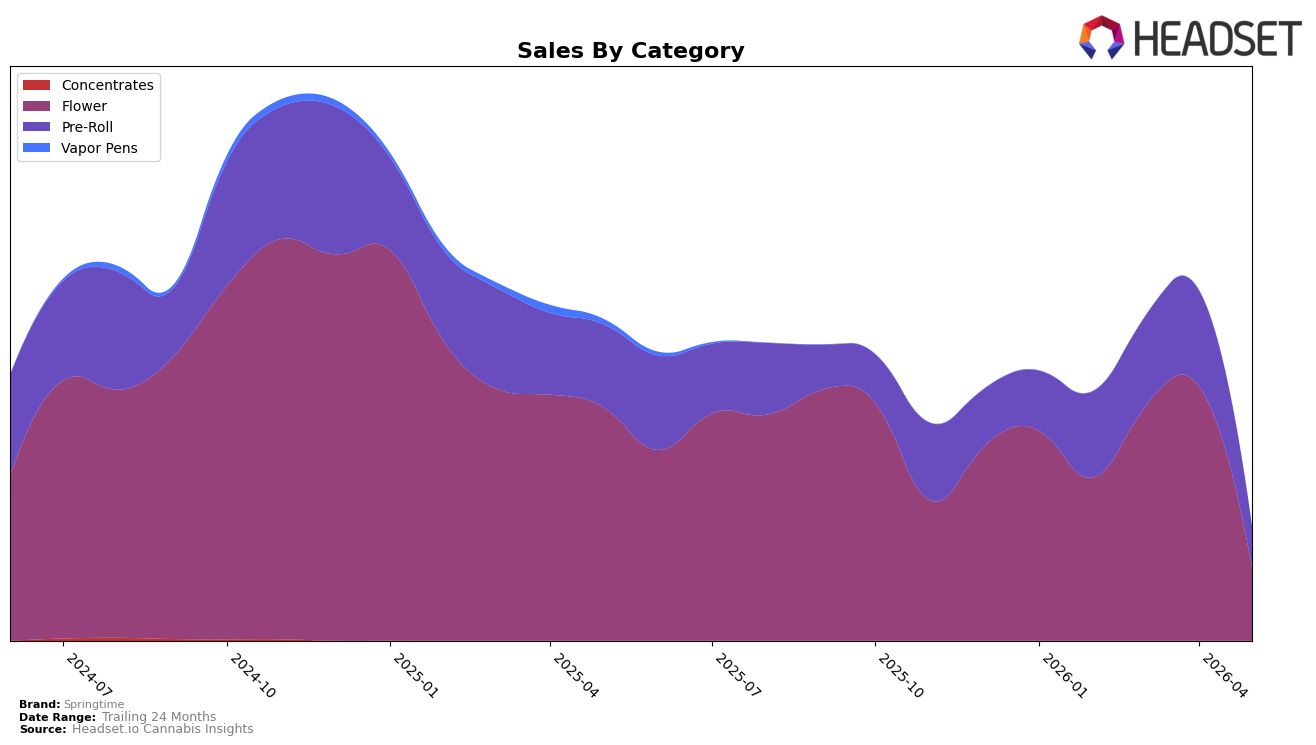
Springtime concentrated 63.46% of May 2026 sales in Flower while 36.54% came from Pre-Roll, yet both pillars contracted sharply: Flower declined 68.86% year over year and 71.50% month over month, and Pre-Roll fell 49.59% year over year and 56.48% month over month. Average price rose 88.65% year over year to $20.90 while Flower pricing averaged 30.01 and Pre-Roll 13.69, aligning with a volume-led pullback rather than mix-upside; in Connecticut Flower held rank 17, indicating mid-pack presence despite shrinking share. The pattern implies over-reliance on Flower left the brand exposed to accelerated monthly attrition while price inflation limited elasticity, making the current mix a drag on total momentum.
With Flower down 71.50% month over month versus Pre-Roll down 56.48%, the heavier-weighted category amplified the total decline, while the 68.86% year-over-year Flower contraction outpaced the 49.59% Pre-Roll drop, signaling category-specific headwinds rather than broad brand withdrawal. Holding a 63.46% Flower share alongside rank 17 in Connecticut positions Springtime as a price-elevated, volume-constrained player whose mix tilts toward the weakest trajectory segments; the implication is that shifting 10–15 percentage points of mix toward Pre-Roll or other faster-recovering formats could reduce downside beta and improve month-to-month stability.
Competitive Landscape
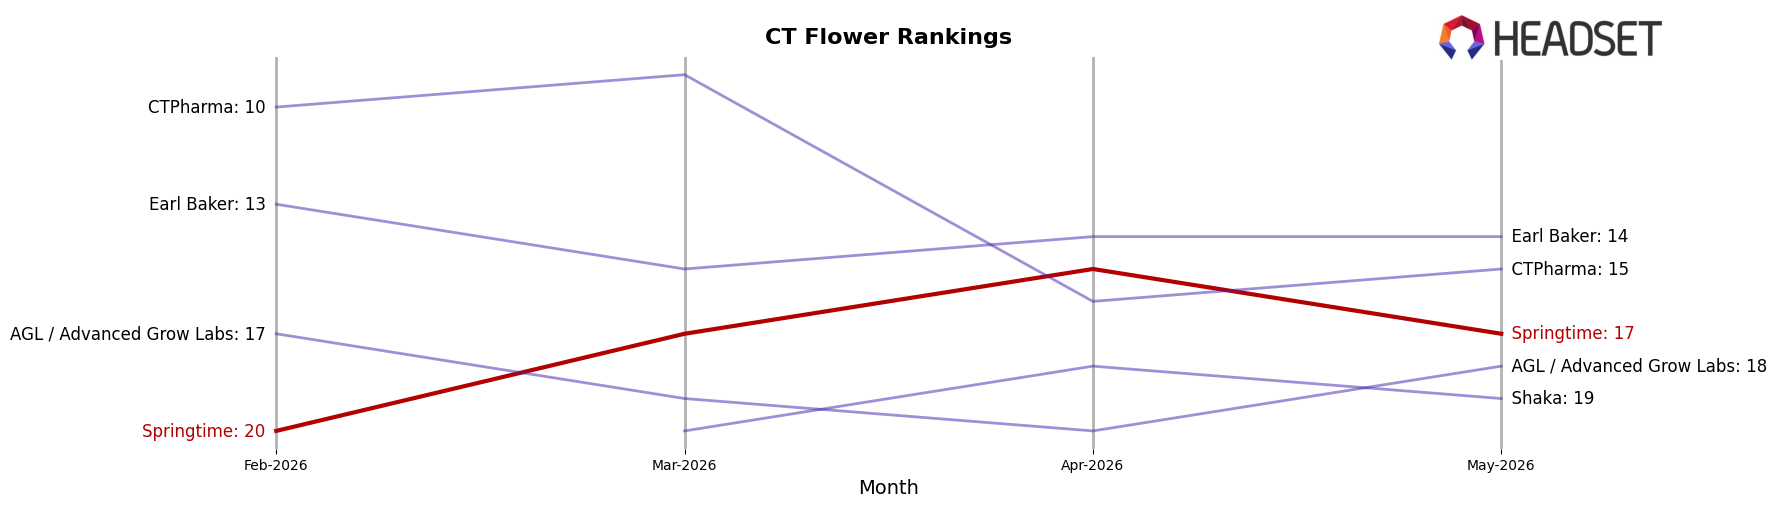
Springtime ranks #17 in Connecticut Flower in May 2026, improving 3 positions from #20 in February 2026, while its peak of #15 in April 2026 marks a 2-position slide into May; in contrast, Theraplant holds #1 with a year-over-year climb of 8 ranks and 137.3% sales growth, and RYTHM sits at #4 with a 7-rank YoY gain alongside 65.5% sales growth, outpacing Springtime’s recent two-position month-over-month dip from April 2026 to May 2026. With Affinity Grow at #5 despite a -6.4% YoY sales change and Let's Burn entrenched at #2, the ladder is tightening above Springtime even as it moved 15% up the rankings since February (from #20 to #17) but 13% down month over month (from #15 to #17), implying Springtime’s trajectory is stabilizing mid-pack unless it converts April 2026’s peak into sustained rank gains.
Notable Products
Jet Fuel OG Pre-Roll (1g) posted the steepest decline in May 2026, dropping -66.5% month over month and sitting at rank 7, while Devi 11 #1 (3.5g) fell -58.4% to rank 6, indicating a sharp reset in recent high-flyers. Chimera Junky Pre-Roll (1g) also slid -47.4% and ranked 4, yet Whiplash Pre-Roll (1g) held rank 1 and generated $71,051, signaling concentration at the very top despite broad pullbacks. Four of the top ten are Pre-Roll SKUs and five are Flower SKUs, with Pre-Rolls spanning ranks 1–4 and 7, implying category weight but heightened volatility compared to steadier Flower placements at ranks 5–10. Taken together, the mix points to reliance on a single flagship supported by a volatile Pre-Roll bench, suggesting Springtime’s commercial direction benefits from shoring up mid-tier stability in Flower while rationalizing Pre-Roll depth.
Top Selling Cannabis Brands
Data for this report comes from real-time sales reporting by participating cannabis retailers via their point-of-sale systems, which are linked up with Headset’s business intelligence software. Headset’s data is very reliable, as it comes digitally direct from our partner retailers. However, the potential does exist for misreporting in the instance of duplicates, incorrectly classified products, inaccurate entry of products into point-of-sale systems, or even simple human error at the point of purchase. Thus, there is a slight margin of error to consider. Brands listed on this page are ranked in the top twenty within the market and product category by total retail sales volume.

