Jun-2026
Sales
Trend
6-Month
Product Count
SKUs
Avg Price
YoY Sales Change
YoY Price Change
Market Insights Snapshot
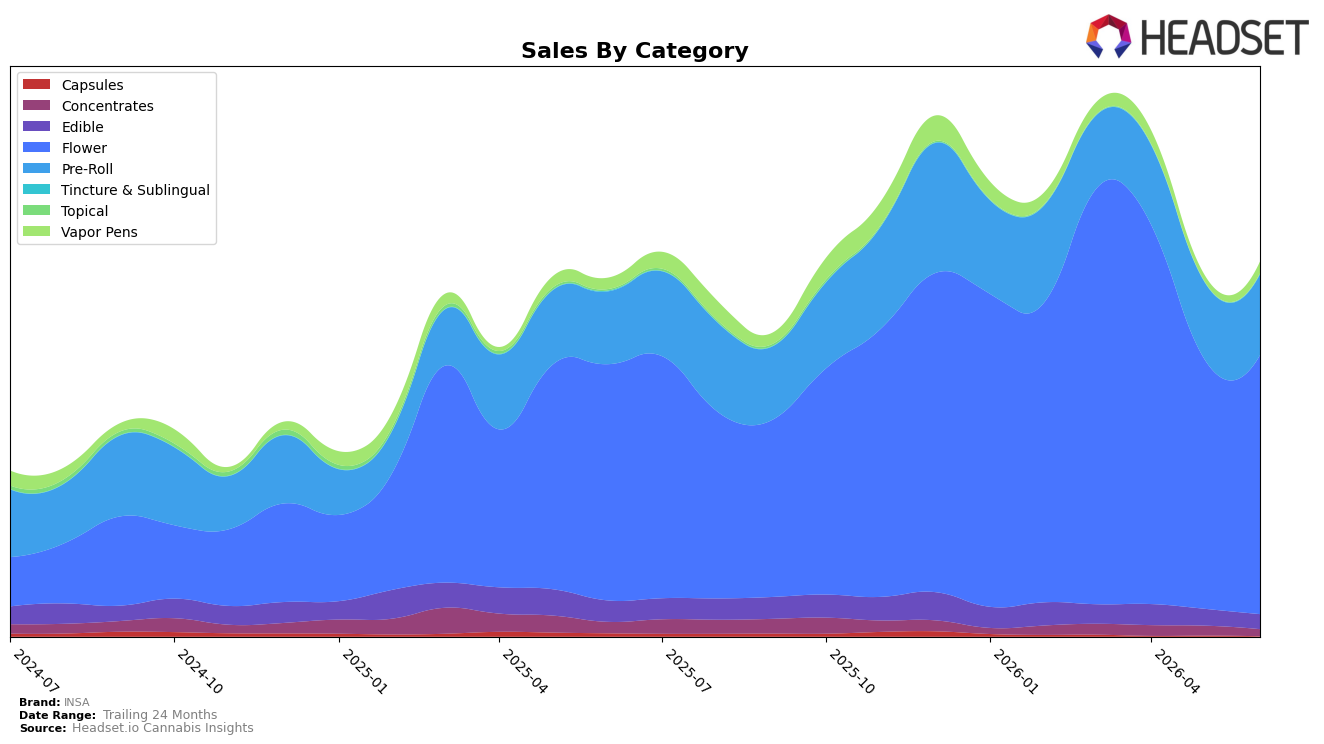
In June 2026, INSA’s mix concentrated further into Flower at 69.49% share, up with 9.61% year-over-year growth and a 3.87% month-over-month lift, while Pre-Roll held 21.61% share with 10.97% YoY and 4.71% MoM gains; together, these two categories account for 91.10% of sales and expanded concurrently despite a 17.48% YoY drop in average price to $20.14. Vapor Pens posted a sharp 86.70% MoM increase on 3.06% share alongside a smaller 2.94% YoY rise, contrasting with Edible at 3.93% share declining 30.32% YoY and 11.17% MoM, and Concentrates at 1.80% share falling 39.42% YoY and 30.02% MoM. This pattern implies INSA is doubling down on inhalables—particularly Flower and Pre-Roll—with opportunistic recovery in Vapor Pens, while deprioritizing Edible and Concentrates under price compression.
Given Flower’s 12th-place rank in Massachusetts and its 69.49% portfolio weight, the simultaneous growth of Flower (+9.61% YoY, +3.87% MoM) and Pre-Roll (+10.97% YoY, +4.71% MoM) positions INSA as a value-forward inhalables player responding to lower price points, as indicated by the brand-level average price down 17.48% YoY. The 86.70% MoM surge in Vapor Pens suggests selective assortment or promo activation to hedge against Flower concentration, while double-digit contractions in Edible (−30.32% YoY) and Concentrates (−39.42% YoY) point to a pullback from slower-turning form factors; the implication is a deliberate focus on velocity categories to defend share and improve rank density within inhalables before re-expanding breadth.
Competitive Landscape
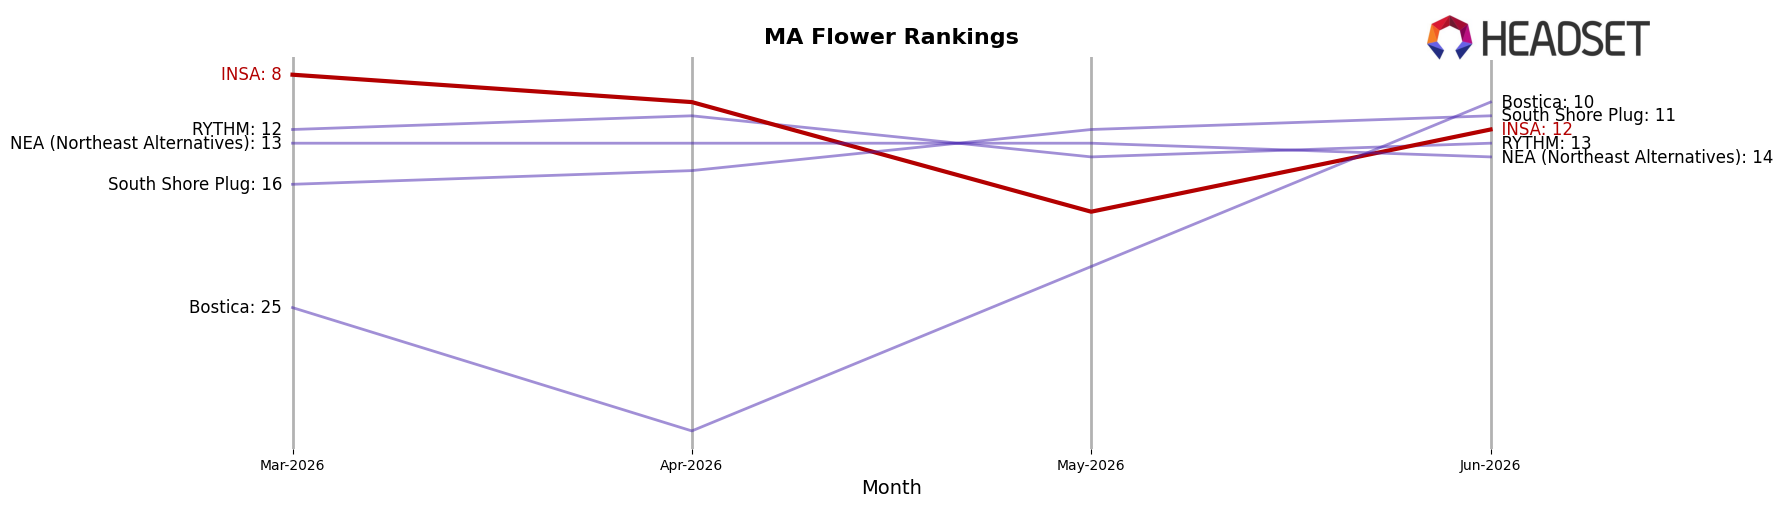
INSA is ranked #12 in Massachusetts Flower for June 2026, down 9 positions year over year from #21 to #12, and 4 positions lower than its #8 spot in March 2026, while its three-month slide from #8 to #12 contrasts with Farmer's Cut moving up from #3 to #1 alongside a 32.4% YoY sales increase and Root & Bloom rising from #16 to #5 with 158.9% YoY growth; compared to Simply Herb, which eased from #1 to #2 with a 1.6% YoY sales decline but still held a top-two rank, INSA’s retreat from its peak rank of #8 in March 2026 to #12 in June 2026 indicates that recent share pressure is concentrated among faster-advancing value and momentum players, implying the rank trajectory points to erosion of relative shelf velocity unless mix or pricing resets in the next quarter.
Notable Products
Nitro Fumez Pre-Roll (1g) posted the steepest decline at -7.8% month over month in June 2026 while holding rank 5, whereas Face Melter Nitrobliterator Infused Pre-Roll (1g) climbed 31.7% to secure rank 1, indicating mix polarization around a single breakout. With Wedding Cake Pre-Roll (1g) at rank 2 and Triangle Pie Pre-Roll (1g) at rank 3, four of the top five are Pre-Roll SKUs, and 22 Lemons Pre-Roll (1g) edged up 2.1% at rank 7 as Green Velvet OG Pre-Roll (1g) advanced 14.9% at rank 8, pointing to breadth within the format rather than a one-SKU spike. Amalfi Coast (3.5g) landed at rank 9 with $24,631 in sales, but the absence of double-digit MoM movement in Flower versus double-digit gains at the top of Pre-Rolls signals resource pull toward infused and classic Pre-Rolls as the commercial priority.
Top Selling Cannabis Brands
Data for this report comes from real-time sales reporting by participating cannabis retailers via their point-of-sale systems, which are linked up with Headset’s business intelligence software. Headset’s data is very reliable, as it comes digitally direct from our partner retailers. However, the potential does exist for misreporting in the instance of duplicates, incorrectly classified products, inaccurate entry of products into point-of-sale systems, or even simple human error at the point of purchase. Thus, there is a slight margin of error to consider. Brands listed on this page are ranked in the top twenty within the market and product category by total retail sales volume.

