.svg)

Sep-2026
Sales
Trend
6-Month
Product Count
SKUs
Avg Price
YoY Sales Change
YoY Price Change


Where to Buy
Punch Extracts / Punch Edibles is stocked at 714 licensed dispensaries across California, Oklahoma, and 4 other states, 507 of them in California, with the deepest coverage in Los Angeles, Sacramento, San Diego, San Francisco, and San Jose. Search by ZIP code or city below to find the closest one, or filter by product type if you are after a specific format.
Market Insights Snapshot
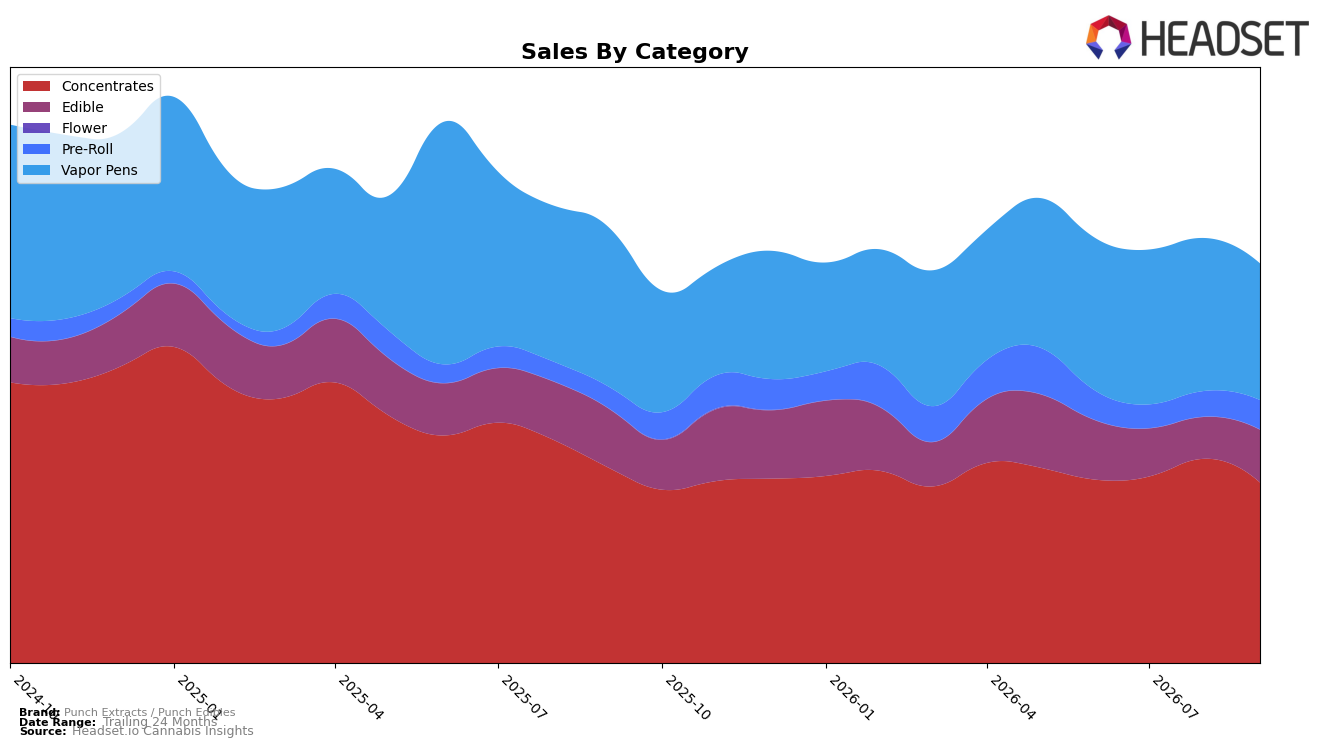
Punch Extracts / Punch Edibles concentrated 45.28% of September 2026 sales in Concentrates, where sales declined 7.68% year over year and 11.64% month over month, while Vapor Pens held 34.24% share with steeper contractions of 14.38% YoY and 10.64% MoM. Countering those drops, Edible climbed 26.35% MoM despite a 10.93% YoY dip to reach 13.17% share, and Pre-Roll advanced 14.60% MoM and 36.68% YoY to 7.31% share. With an average price up 6.01% YoY to $17.77 and Concentrates ranked 4 in California, the mix signals dependence on two contracting pillars (Concentrates and Vapor Pens) while momentum concentrates in smaller but faster-moving formats (Pre-Roll and Edible), implying near-term growth relies on reallocating attention toward the categories posting double‑digit MoM gains.
The shift—double‑digit MoM growth in Pre-Roll (+14.60%) and Edible (+26.35%) alongside double‑digit MoM declines in Concentrates (‑11.64%) and Vapor Pens (‑10.64%)—suggests Punch Extracts / Punch Edibles can defend category visibility by leveraging its Concentrates rank of 4 while using the faster velocity in Pre-Roll and Edible to offset a brand-level YoY sales decline of 8.41%. Given Vapor Pens’ 14.38% YoY contraction versus Concentrates’ 7.68% YoY dip, prioritizing SKUs where price elasticity is more favorable (e.g., Edible at a $10.30 average price versus Concentrates at $20.03) positions the brand to rebalance mix toward categories with improving unit throughput, implying that sustained share stabilization will come from expanding the two smaller, growing segments rather than waiting for recovery in the two larger, shrinking ones.
Competitive Landscape
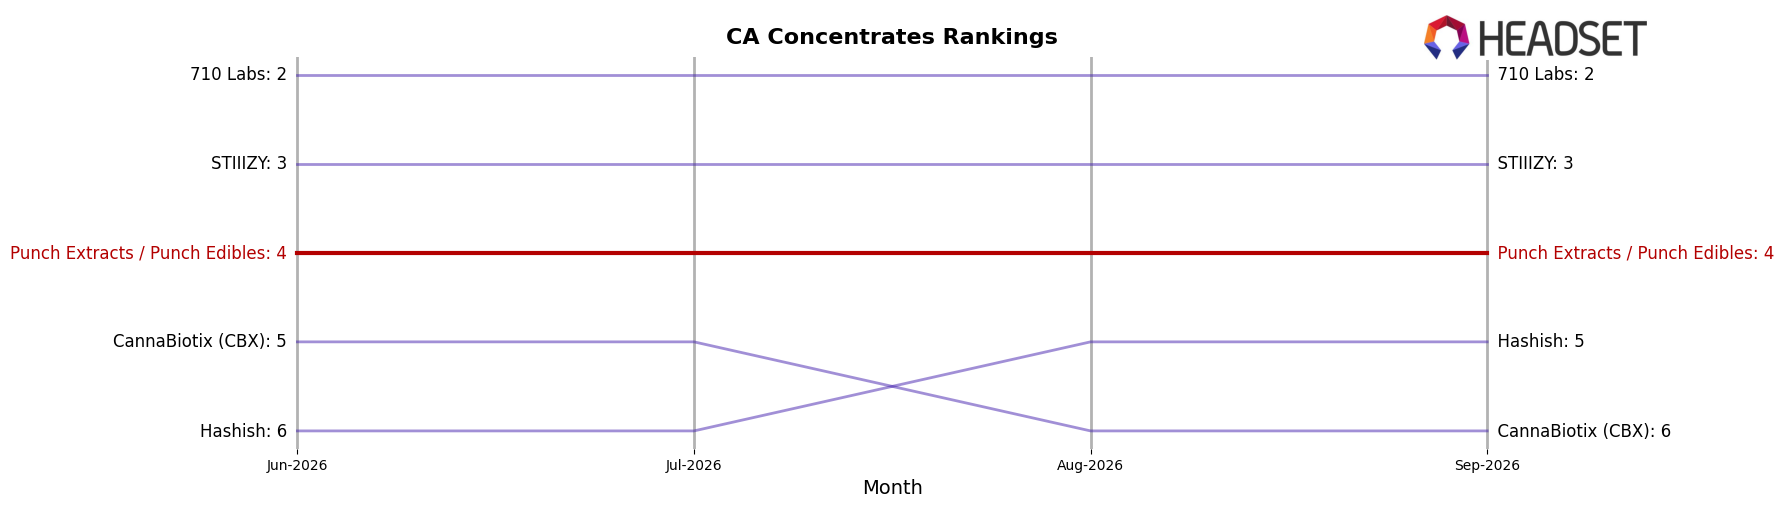
Punch Extracts / Punch Edibles sits at rank #4 in California Concentrates in September 2026, down one position from rank #3 year over year, and flat versus rank #4 three months ago, while its historical peak was rank #2 in April 2025. In contrast, Raw Garden holds rank #1 with a 9.37% year-over-year sales increase and 710 Labs advanced from rank #4 to #2 with 32.70% growth, edging ahead of Punch Extracts / Punch Edibles as STIIIZY remains at #3 with 6.17% growth; meanwhile, Hashish sits at #5 after climbing from #9 with 92.03% growth. The pattern implies Punch Extracts / Punch Edibles is holding a top-5 position but ceding relative momentum to faster-rising rivals, so maintaining #4 will likely require offense against the upward pressure from #2 and #5.
Notable Products
The steepest decline came from Blue Z Distillate Cartridge (1g), which fell 24.6% month over month and slid to rank 3, while The Z Distillate Cartridge (1g) dropped 10.4% to rank 4; by contrast, Blue Dream Distillate Cartridge (1g) rose 10.8% to hold rank 1 with approximately $31,971 in September 2026. Four of the top ten are Vapor Pens SKUs concentrated in distillate, yet Strawberry Lemonade Gummies 10-Pack (100mg) also contracted 10.3% at rank 6, implying flavor-driven edible volatility alongside distillate softness. The mix points to a pivot need toward stabilizing non-Z distillate offerings and selectively reinforcing edibles to hedge against strain-specific swings in September 2026.
Top Selling Cannabis Brands






Data for this report comes from real-time sales reporting by participating cannabis retailers via their point-of-sale systems, which are linked up with Headset’s business intelligence software. Headset’s data is very reliable, as it comes digitally direct from our partner retailers. However, the potential does exist for misreporting in the instance of duplicates, incorrectly classified products, inaccurate entry of products into point-of-sale systems, or even simple human error at the point of purchase. Thus, there is a slight margin of error to consider. Brands listed on this page are ranked in the top twenty within the market and product category by total retail sales volume.

