Jun-2026
Sales
Trend
6-Month
Product Count
SKUs
Avg Price
YoY Sales Change
YoY Price Change
Market Insights Snapshot
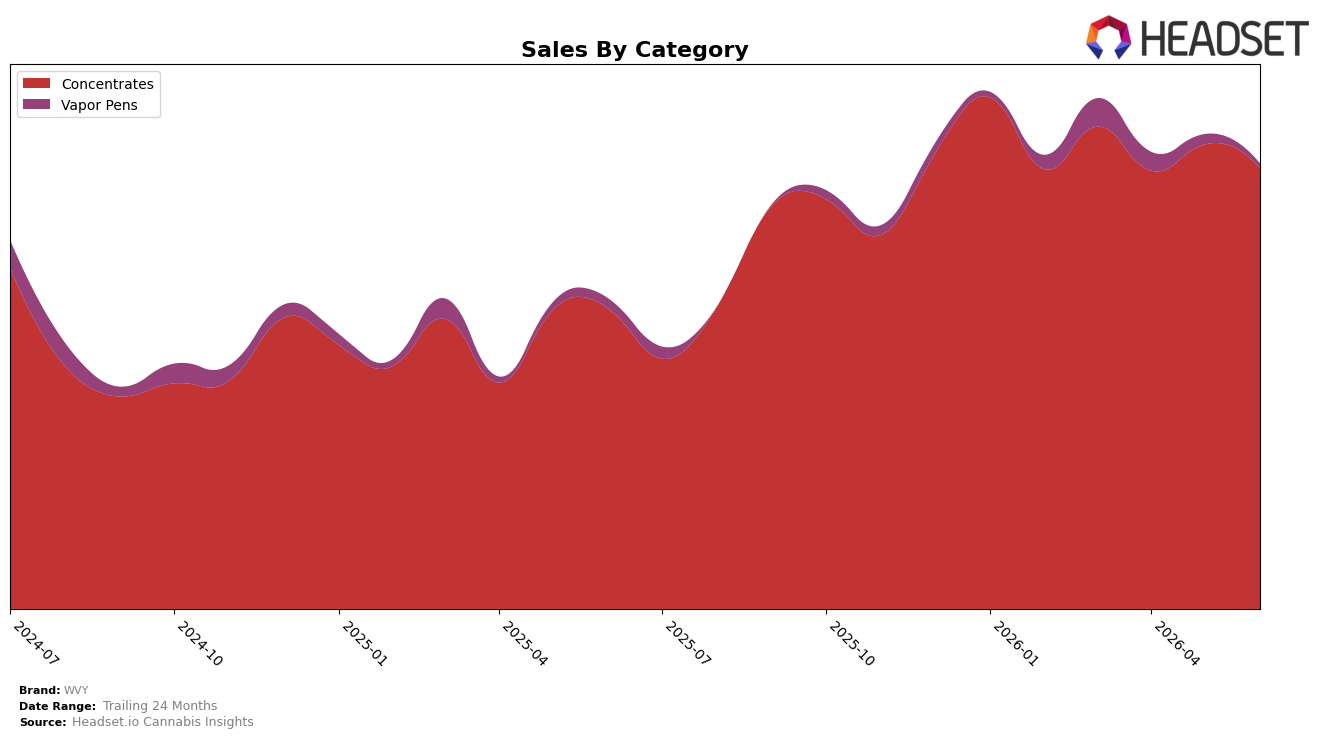
WVY’s mix in June 2026 is concentrated in Concentrates at 98.02% share with a year-over-year change of 46.11% and a month-over-month decline of 5.05%, while Vapor Pens hold 1.98% share with a year-over-year drop of 37.64% and a month-over-month fall of 38.60%. Average price declined 8.64% year over year to $10.26, and Concentrates’ average price of $10.21 sits below Vapor Pens at $13.32, indicating price-led volume in the core while premium positioning is eroding in the fringe. This mix, paired with a June 2026 Concentrates rank of 6 in California, implies WVY is trading depth for breadth: growth is concentrated where it already competes, and the shrinking Vapor Pens slice limits optionality if category tailwinds shift.
With 98.02% exposure to Concentrates and a rank of 6 in California, WVY is positioned as a category specialist whose June 2026 growth (+46.11% YoY in Concentrates) is sensitive to single-category volatility (-5.05% MoM). The 38.60% MoM and 37.64% YoY declines in Vapor Pens reduce cross-category insulation, and the 8.64% YoY price decrease suggests a value-led stance that may defend share but compress mix quality if pricing must remain below the $13.32 seen in Vapor Pens. The pattern implies WVY’s near-term share is most defensible by maintaining rank in Concentrates while selectively rebuilding a small, higher-margin second pillar so month-to-month swings do not over-index on one category.
Competitive Landscape
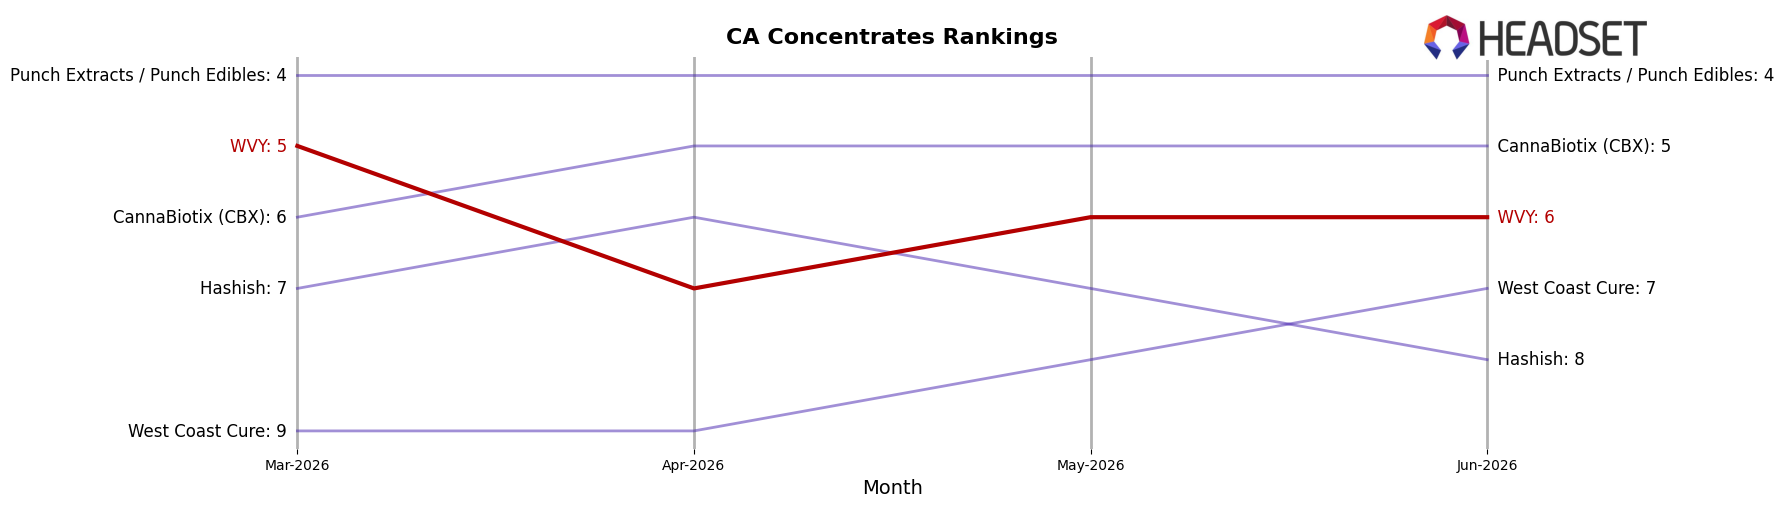
WVY ranks #6 in CA Concentrates in June 2026, improving 1 position from #7 year over year, but slipping 1 spot from #5 in March 2026 when it hit its peak. Against competitors, Raw Garden held #1 year over year and remains #1, while 710 Labs climbed from #4 to #3 as its sales grew 24.7%, and Punch Extracts / Punch Edibles moved down from #3 to #4 amid a 29.1% sales decline; in contrast, CannaBiotix (CBX) held #5 year over year yet sits one rank ahead of WVY now. The combination of a 1-rank YoY gain and a 1-rank drop from March 2026 implies WVY is stabilizing just below the top five, with competitive pressure from faster-rising peers constraining near-term re-entry into its peak position.
Notable Products
Lemon Cherry Runtz Budder (1g) posted the standout move in June 2026 with a +73.7% month-over-month surge to rank 3, while Berry Nectar Budder (1g) slipped 2 positions to rank 9 on a -10.3% decline. GMO OG Budder (1g) held rank 1 and Platinum Kush Mints Budder (1g) sat at rank 2, and eight of the top ten are Concentrates Budder 1g SKUs, signaling tight clustering at the top and limited category diversification. The dense top-three stack around single-gram Budder formats indicates WVY is concentrating demand in a narrow form factor, implying the commercial push is skewing toward depth in Budder rather than breadth across other product types and sizes, even as one SKU backslides and another adds over $31,000 in incremental monthly sales.
Top Selling Cannabis Brands
Data for this report comes from real-time sales reporting by participating cannabis retailers via their point-of-sale systems, which are linked up with Headset’s business intelligence software. Headset’s data is very reliable, as it comes digitally direct from our partner retailers. However, the potential does exist for misreporting in the instance of duplicates, incorrectly classified products, inaccurate entry of products into point-of-sale systems, or even simple human error at the point of purchase. Thus, there is a slight margin of error to consider. Brands listed on this page are ranked in the top twenty within the market and product category by total retail sales volume.

