.svg)
Sep-2026
Sales
Trend
6-Month
Product Count
SKUs
Avg Price
YoY Sales Change
YoY Price Change


Where to Buy
Hashish is stocked at 69 licensed dispensaries across California and Oklahoma, 62 of them in California, with the deepest coverage in San Diego, La Mesa, Vista, Chula Vista, and Encinitas. Search by ZIP code or city below to find the closest one, or filter by product type if you are after a specific format.
Market Insights Snapshot
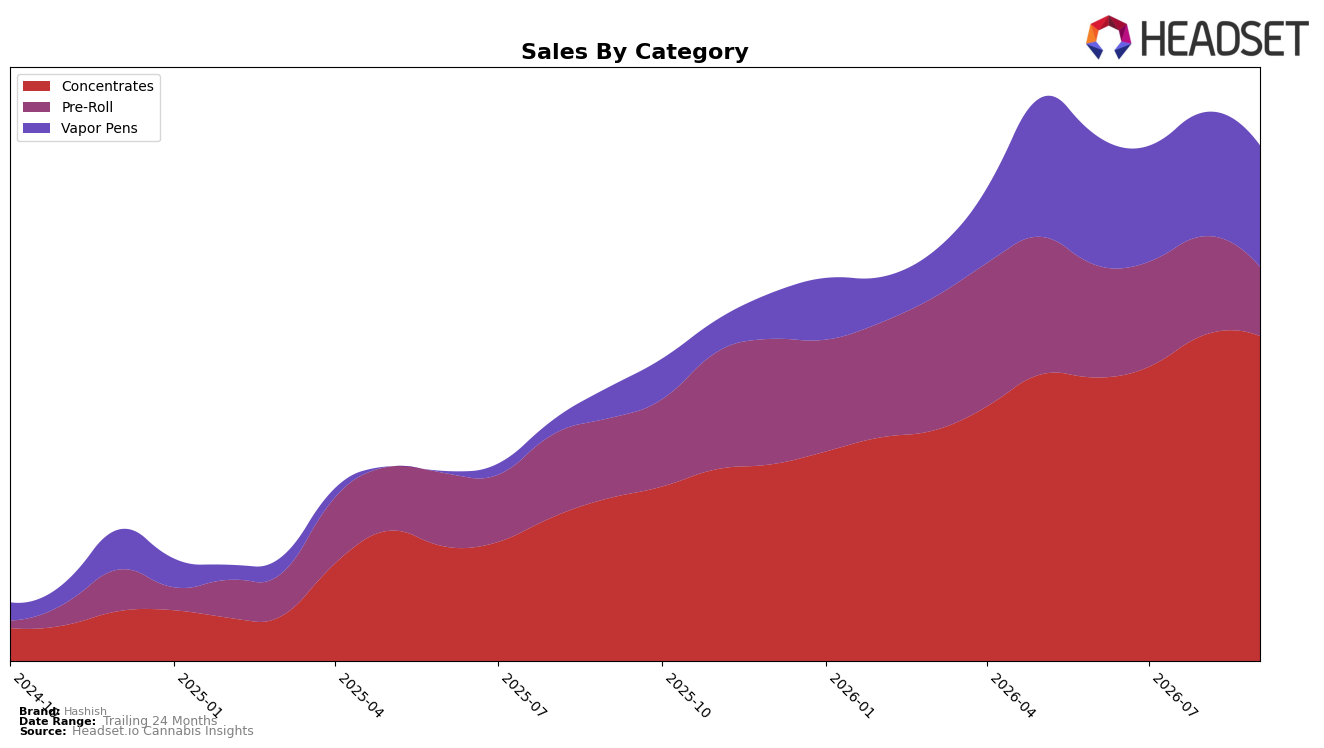
Concentrates held 60.81% share in September 2026, up with 92.03% year-over-year growth but edging down month-over-month by 0.35%, while Vapor Pens at 24.29% share surged 202.44% year-over-year but slipped 1.81% month-over-month; Pre-Roll at 14.90% share contracted 11.49% year-over-year and fell 26.19% month-over-month. With Hashish ranked 5 in Concentrates in California and average prices up 35.29% year-over-year to $27.48, the mix shift toward higher-priced Concentrates and fast-growing Vapor Pens implies a deliberate tilt to potency-led formats even as near-term monthly softness tempers momentum in September 2026.
The 92.03% year-over-year growth in Concentrates alongside a 202.44% rate in Vapor Pens, versus a 11.49% decline in Pre-Roll and a 26.19% month decline there, indicates Hashish is consolidating around extract-forward occasions, reinforcing a premiumization arc as the Concentrates anchor supports category rank 5 in California. Given Concentrates’ 60.81% share and Vapor Pens at 24.29% while Pre-Roll recedes to 14.90%, the brand’s positioning is skewing toward fewer, higher-value puffs and potency-per-dollar propositions, which should prioritize assortment depth in dabbable and cart formats over combustibles to sustain share as price increases of 35.29% year-over-year raise the threshold for trial.
Competitive Landscape
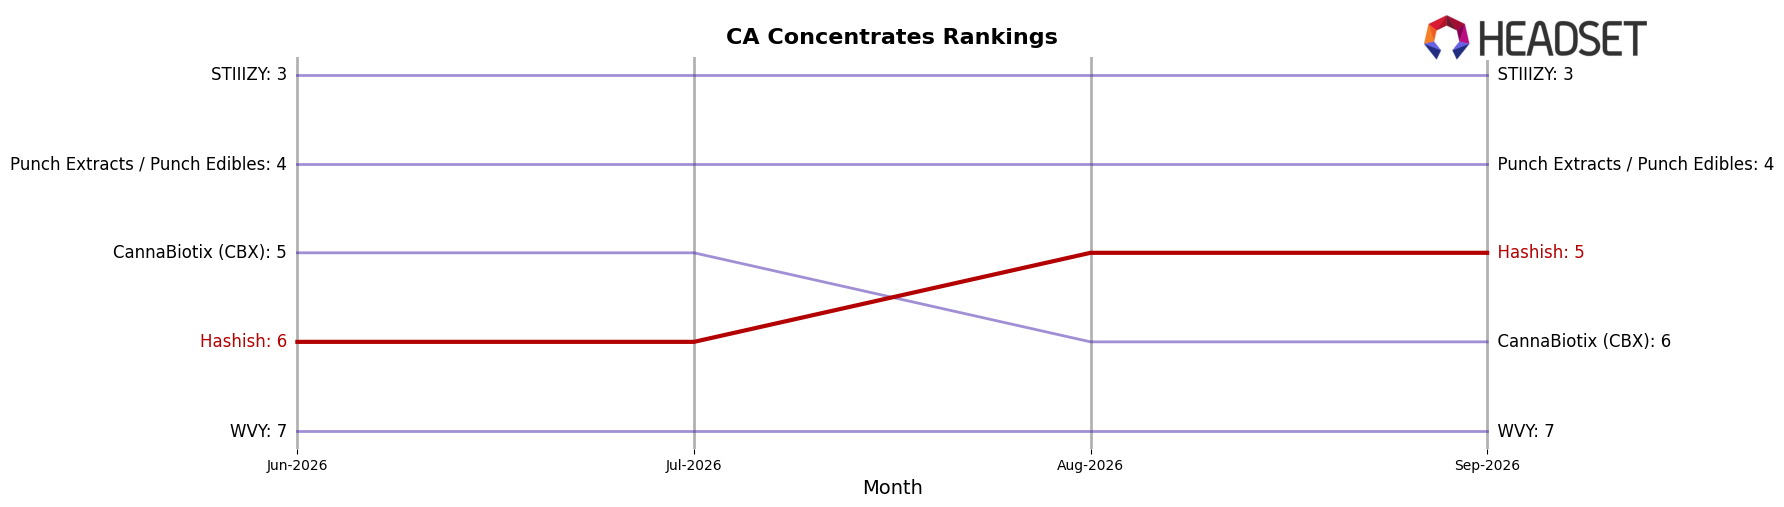
Hashish sits at rank #5 in CA Concentrates in September 2026, improving 4 positions from #9 year over year and edging up 1 spot from #6 in June 2026, while reaching a new peak rank of #5 in September 2026; in contrast, 710 Labs advanced from #4 to #2 year over year and Punch Extracts / Punch Edibles slipped from #3 to #4 despite a -7.68% YoY sales change, indicating that Hashish’s climb into the top five amid competitors moving both up and down implies a momentum-driven consolidation toward upper-tier positioning rather than temporary volatility.
Notable Products
Toad Venom Rosin Infused Pre-Roll (1g) posted the steepest movement in September 2026 with a -75.6% month-over-month drop while sitting at rank 10, and Fruit Hoopz Infused Pre-Roll (1g) also contracted -63.2% at rank 8. In contrast, Cranberry Shortbread Rosin Infused Pre-Roll (1g) rose 21.7% to rank 4, but Strawberry Jack Rosin Infused Pre-Roll (1g) fell -12.2% despite holding rank 1. With four of the top ten landing in Pre-Roll, the divergence between sharp declines at ranks 8 and 10 and modest resilience at rank 4 implies the infused Pre-Roll lineup is fragmenting into winners and laggards that require SKU-level pruning rather than category-wide action.
Mars OG Live Rosin Disposable (1g) advanced 4.7% MoM at rank 3, positioning Vapor Pens alongside OG Mango Live Rosin Disposable (1g) at rank 5 and Passion Orange Guava Live Rosin Disposable (1g) at rank 7 to account for three of the top seven placements. While rank 1 Pre-Roll delivered the largest unit volume, a single raw dollar figure of $49,236 at rank 3 indicates Vapor Pens can now rival top Pre-Roll contributions with positive momentum. The pattern implies a gradual rotation toward Vapor Pens as the steadier growth engine while Pre-Roll acts as a volatility driver that needs tighter assortment control.
Top Selling Cannabis Brands






Data for this report comes from real-time sales reporting by participating cannabis retailers via their point-of-sale systems, which are linked up with Headset’s business intelligence software. Headset’s data is very reliable, as it comes digitally direct from our partner retailers. However, the potential does exist for misreporting in the instance of duplicates, incorrectly classified products, inaccurate entry of products into point-of-sale systems, or even simple human error at the point of purchase. Thus, there is a slight margin of error to consider. Brands listed on this page are ranked in the top twenty within the market and product category by total retail sales volume.

