.svg)

Sep-2026
Sales
Trend
6-Month
Product Count
SKUs
Avg Price
YoY Sales Change
YoY Price Change


Where to Buy
Maven Genetics is stocked at 425 licensed dispensaries across California and Oklahoma, 424 of them in California, with the deepest coverage in Los Angeles, San Diego, Sacramento, Santa Ana, and Costa Mesa. Search by ZIP code or city below to find the closest one, or filter by product type if you are after a specific format.
Market Insights Snapshot
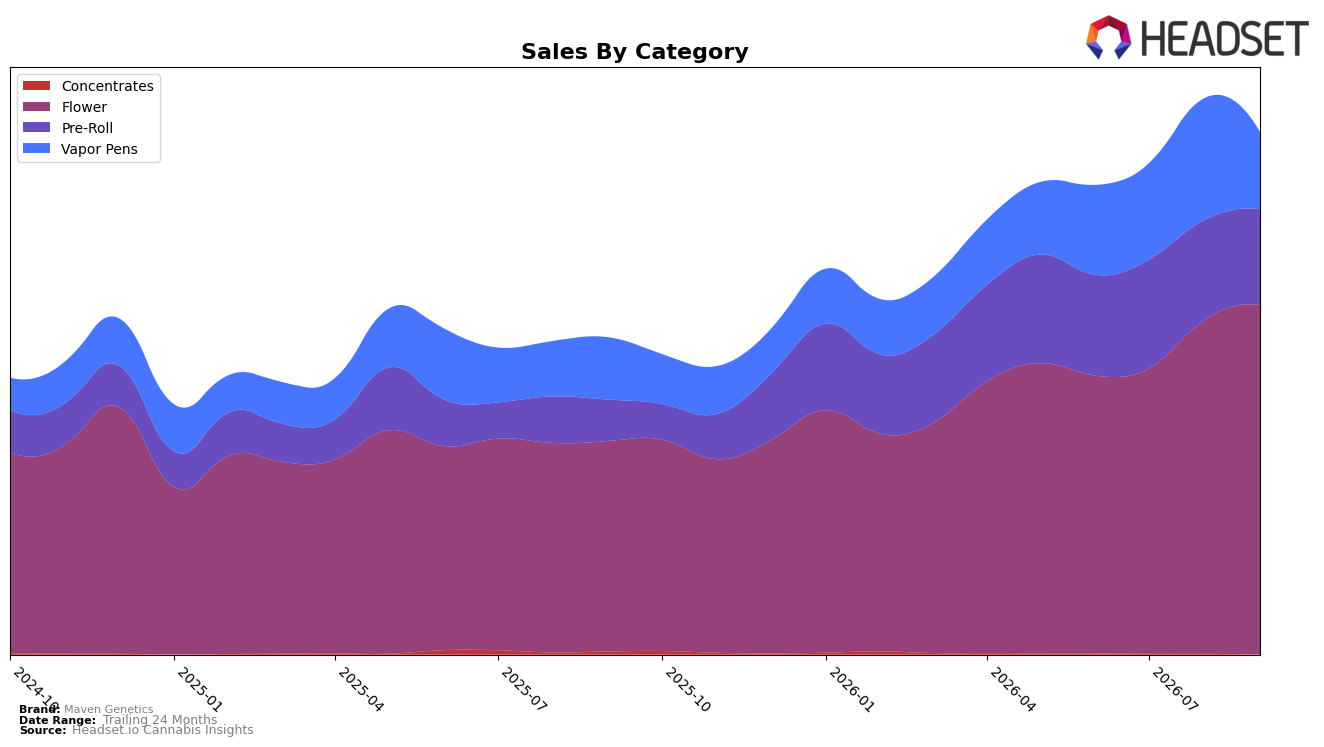
Maven Genetics concentrated 66.88% of September 2026 sales in Flower with year-over-year growth of 66.02% and month-over-month growth of 4.59%, while Pre-Roll held 18.30% share with 131.63% YoY but a 4.35% MoM decline. Vapor Pens accounted for 14.78% share with 24.24% YoY but a steep 36.61% MoM contraction, and Concentrates fell to 0.04% share with a 93.30% YoY drop and 65.10% MoM decline. Given a 15th rank in Flower in California and a 15.80% YoY decline in average price to $26.83, the pattern implies Maven Genetics is tilting volume toward value-led Flower and Pre-Roll while rapidly exiting low-scale Concentrates and absorbing short-term volatility in Vapor Pens.
The shift toward a two-pillar mix — 66.88% Flower with positive MoM and 18.30% Pre-Roll with triple-digit YoY — paired with a 36.61% MoM pullback in Vapor Pens and a 0.04% Concentrates footprint, implies a focus on winning share where price elasticity is favorable and price moves can defend rank 15 in California Flower. The combination of 64.84% brand-level YoY growth and a 15.80% price deflation suggests unit expansion is doing the heavy lifting, so sustaining momentum likely hinges on reinforcing Flower assortment breadth while stabilizing Vapor Pen availability to prevent further month-to-month drag.
Competitive Landscape
Maven Genetics sits at rank 15 in CA Flower in September 2026, improving 9 positions year over year from rank 24, and edging up 2 ranks from June 2026’s position at 17; this matches a new peak rank of 15 in September 2026 and places the brand outside the top 10 while the category leader STIIIZY holds rank 1 after rising from rank 2 and expanding sales by 47.8% year over year. Against the upper tier, CAM moved from rank 3 to rank 2 as of September 2026 with sales up 28.9%, while CannaBiotix (CBX) slid from rank 1 to rank 3 alongside a 21.1% sales decline, indicating that Maven Genetics’ climb of 9 ranks year over year coupled with a near-term 2-rank improvement positions it as an upwardly mobile mid-pack player whose trajectory suggests share capture potential if momentum holds.

Notable Products
Prizm (3.5g) posted the steepest decline in September 2026 at -35.2% MoM and slid to rank 9, while Pineapple Biscotti (3.5g) dropped -16.6% MoM at rank 3, indicating volatility concentrated in the lower half of the top 10. In contrast, FKAFL (3.5g) rose +37.0% MoM to rank 4 and Black Lotus (3.5g) climbed +33.1% MoM to rank 2, signaling intra-portfolio substitution rather than category-level pressure. With Lemon Cherry Tropicana (3.5g) steady at rank 1 and all top-10 entries in Flower, the product mix points to a deliberate tilt toward a few momentum strains within Flower that can absorb shocks from double-digit decliners without eroding the brand’s rank leadership and revenue concentration.
Top Selling Cannabis Brands






Data for this report comes from real-time sales reporting by participating cannabis retailers via their point-of-sale systems, which are linked up with Headset’s business intelligence software. Headset’s data is very reliable, as it comes digitally direct from our partner retailers. However, the potential does exist for misreporting in the instance of duplicates, incorrectly classified products, inaccurate entry of products into point-of-sale systems, or even simple human error at the point of purchase. Thus, there is a slight margin of error to consider. Brands listed on this page are ranked in the top twenty within the market and product category by total retail sales volume.

