Feb-2026
Sales
Trend
6-Month
Product Count
SKUs
Avg Price
YoY Sales Change
YoY Price Change
Market Insights Snapshot
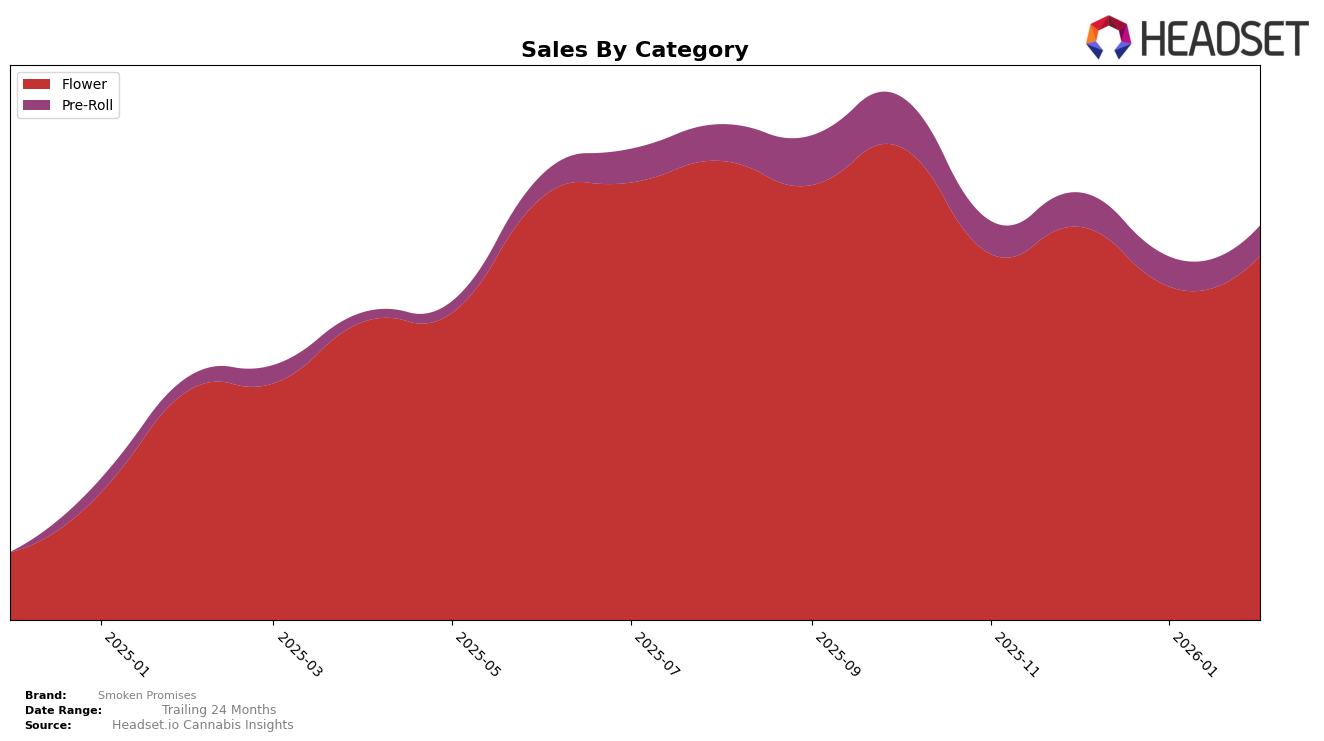
Smoken Promises has shown varied performance across different states and categories, with notable movements in rankings and sales figures. In the Arizona flower category, the brand has seen a decline, dropping from 30th in November 2025 to 36th by February 2026. This downward trend is reflected in the sales figures, which decreased from $219,758 to $170,516 over the same period. In contrast, in California, Smoken Promises maintained a more stable presence in the flower category, hovering around the 25th to 29th rankings during the same months. This stability is complemented by a slight increase in sales from $741,323 in January 2026 to $802,611 in February 2026, suggesting a potential recovery or strategic adjustment in this key market.
In the pre-roll category in California, Smoken Promises did not break into the top 30 rankings, with positions ranging from 93rd to 95th between December 2025 and February 2026. The absence from the top 30 may indicate challenges in gaining traction within this segment, despite a modest sales increase from $80,623 in January 2026 to $81,647 in February 2026. The brand's performance across these categories highlights a mix of stability and challenges, with potential areas for growth and strategic focus, particularly in the pre-roll market where they have yet to establish a significant presence. The data suggests that while Smoken Promises is holding its ground in certain areas, there are opportunities for improvement and expansion.
Competitive Landscape
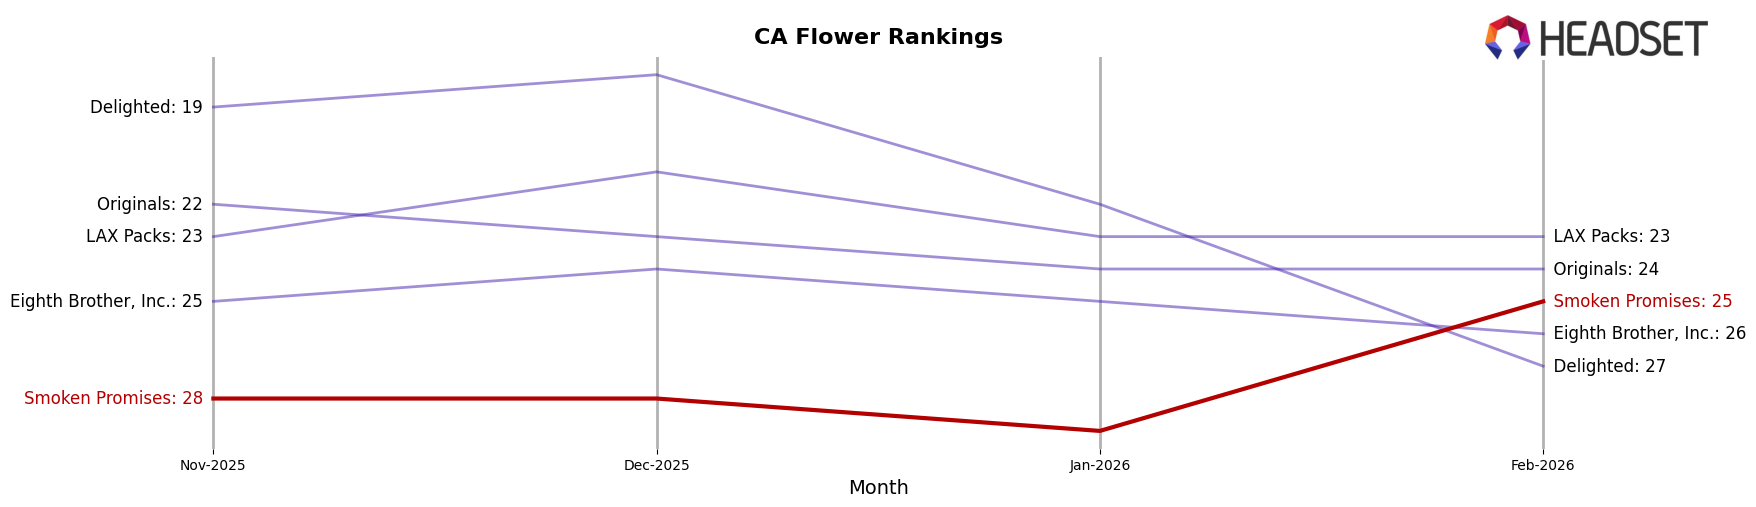
In the competitive landscape of the flower category in California, Smoken Promises has shown a noteworthy improvement in its ranking, climbing from 29th in January 2026 to 25th by February 2026. This upward movement is significant, especially when compared to competitors like Delighted, which saw a decline from 22nd to 27th in the same period. Meanwhile, LAX Packs maintained a steady position at 23rd, and Originals remained stable at 24th. Despite Eighth Brother, Inc. not breaking into the top 20, their sales figures suggest a competitive edge over Smoken Promises. The sales trend for Smoken Promises indicates a positive trajectory, aligning with its improved rank, which could be a promising sign for potential growth in market share.
Notable Products
In February 2026, Raspberry Reaper (3.5g) emerged as the top-performing product for Smoken Promises, climbing from fourth place in January to first place, with impressive sales of 4319 units. X-Ray z (3.5g) secured the second position, maintaining its rank from December after not being ranked in January. Love Potion (3.5g), which had been the top product in January, fell to third place despite consistent sales figures. Blue Dream (3.5g) dropped to fourth place after previously holding the top spot in December. Whiplash (3.5g) entered the rankings for the first time in February, debuting in fifth place.
Top Selling Cannabis Brands
Data for this report comes from real-time sales reporting by participating cannabis retailers via their point-of-sale systems, which are linked up with Headset’s business intelligence software. Headset’s data is very reliable, as it comes digitally direct from our partner retailers. However, the potential does exist for misreporting in the instance of duplicates, incorrectly classified products, inaccurate entry of products into point-of-sale systems, or even simple human error at the point of purchase. Thus, there is a slight margin of error to consider. Brands listed on this page are ranked in the top twenty within the market and product category by total retail sales volume.

