Market Insights Snapshot
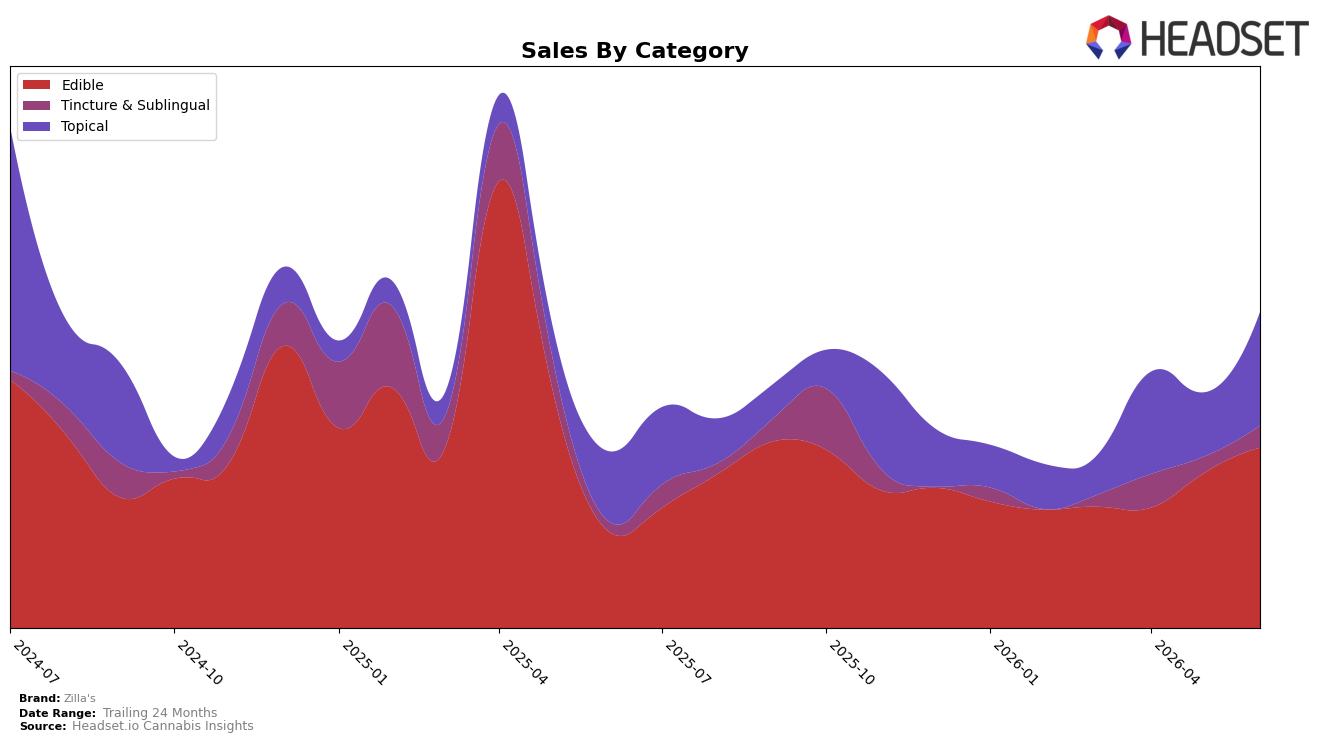
Zilla's concentrated 55.99% of June 2026 sales in Edible, with year-over-year growth of 81.34% and month-over-month growth of 15.50%, while Topical held 35.81% share with 58.37% YoY and a sharper 71.67% MoM surge. Tincture & Sublingual contributed 8.19% share, growing 78.55% YoY and 26.41% MoM. Despite an average price up 12.94% YoY to $19.77, the Edible average price sat lower at 14.90, versus 33.88 in Topical and 33.92 in Tincture & Sublingual, indicating volume-driven gains in Edible alongside higher-ticket momentum in Topical. The mix and price dispersion suggest Zilla's is leaning into accessible Edible volume while rapidly scaling premium-priced Topical, implying a two-speed growth engine where Edible anchors scale and Topical accelerates near-term mix shift.
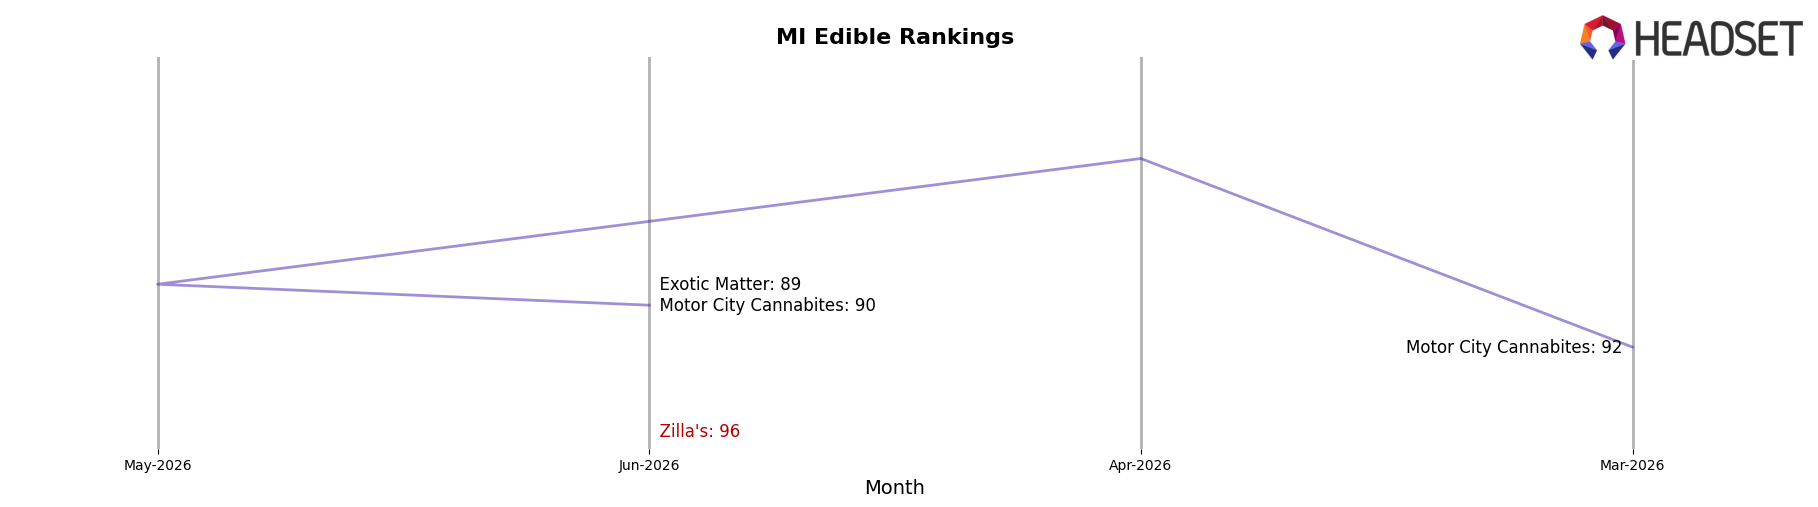
With Edible ranked 96 in Michigan, the 71.67% MoM lift in Topical against a 15.50% MoM rise in Edible points to a mix pivot that can elevate category presence if sustained, even as the broader 24‑month sales trend sits at −10.53%. The 81.34% YoY growth in Edible coupled with 78.55% YoY in Tincture & Sublingual indicates demand across both value and specialty formats, but the higher average prices in Topical and Tincture & Sublingual (33.88 and 33.92) versus 14.90 in Edible signal margin headroom in premium formats; therefore, prioritizing Topical’s momentum while protecting Edible share could improve rank trajectory and mitigate exposure to pricing pressure.
Competitive Landscape
Zilla's ranks #96 in Michigan Edible for June 2026, improving 23 positions from #119 year over year, and rising 20 spots from #116 since March 2026; however, it remains 10 ranks below its peak at #86 from April 2025, indicating partial recovery rather than a full return. At the top end, Wyld held #1 both year over year and in June 2026 while posting a -13.4% YoY sales change, and MKX Oil Company stayed at #3 with +10.8% YoY growth, suggesting Zilla's relative position gains come more from mixed performance among leaders than from a broad category reshuffle; the implication is that the current rank trajectory signals incremental share stabilization rather than momentum sufficient to break back into the top 80 without additional velocity catalysts.
Notable Products
CBD Blue Botanic Balm (1000mg CBD, 2oz) posted the largest move in June 2026 with +118.4% MoM and climbed to rank 5, while CBD Assorted Gummy Butterflies (400mg CBD) fell -58.0% MoM at rank 4. CBD/CBN 1:1 Calm & Sleep CBN Gummy Bears 20-Pack (100mg CBD, 100mg CBN) rose +64.0% MoM at rank 3, and Blueberry Honey (200mg) advanced +20.9% MoM at rank 2; four of the top ten are Edible SKUs, indicating category breadth despite volatility. The coexistence of a triple-digit Topical surge alongside double-digit Edible gains and steep Edible declines implies Zilla's is pivoting toward a mixed portfolio where Topicals can offset Edible swings.
Top Selling Cannabis Brands
Data for this report comes from real-time sales reporting by participating cannabis retailers via their point-of-sale systems, which are linked up with Headset’s business intelligence software. Headset’s data is very reliable, as it comes digitally direct from our partner retailers. However, the potential does exist for misreporting in the instance of duplicates, incorrectly classified products, inaccurate entry of products into point-of-sale systems, or even simple human error at the point of purchase. Thus, there is a slight margin of error to consider. Brands listed on this page are ranked in the top twenty within the market and product category by total retail sales volume.

