Jun-2026
Sales
Trend
6-Month
Product Count
SKUs
Avg Price
YoY Sales Change
YoY Price Change
Market Insights Snapshot
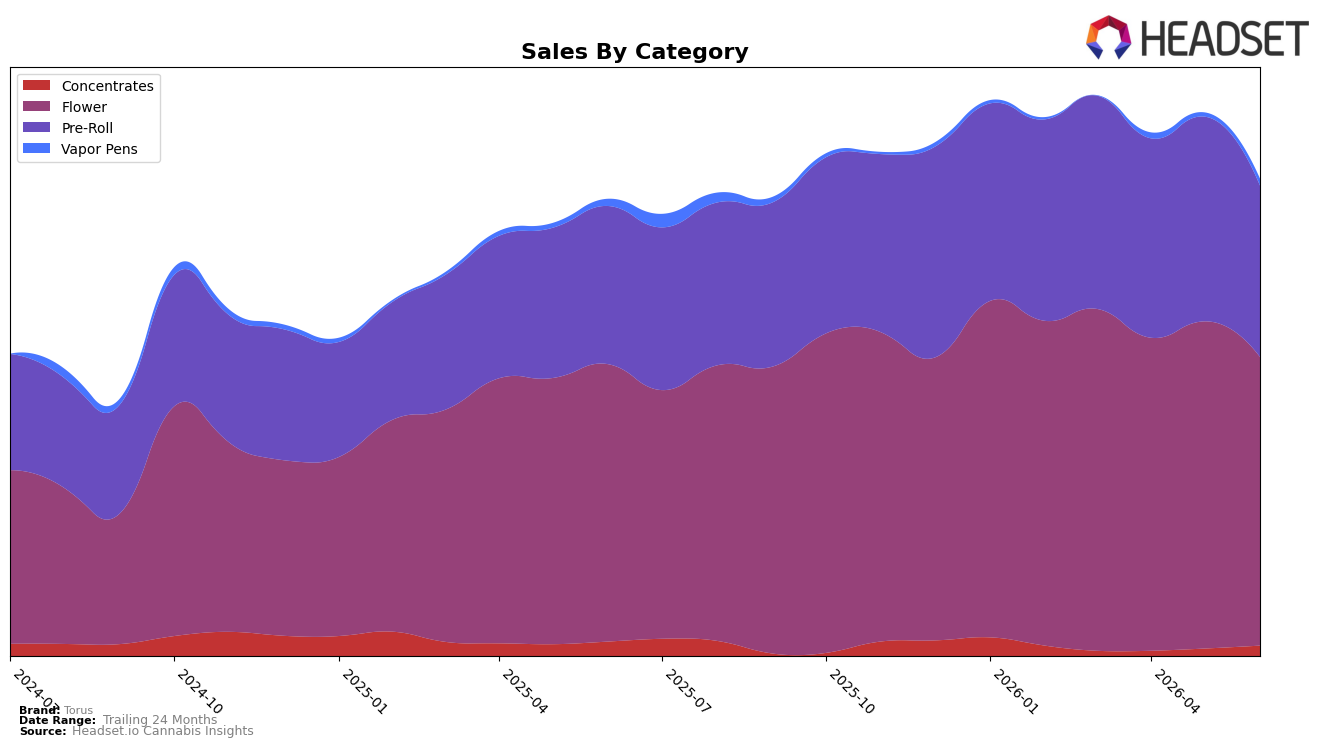
In June 2026, Torus concentrated 59.07% of sales in Flower with year-over-year growth of 4.01% but a month-over-month decline of 11.61%, while Pre-Roll held 35.45% share with 8.09% YoY growth and a 15.92% MoM drop. Smaller lines moved in the opposite direction: Concentrates at 3.12% share fell 20.80% YoY but rose 23.26% MoM, and Vapor Pens at 2.36% share slipped 2.31% YoY yet climbed 29.94% MoM. With brand-level sales up 4.23% YoY and average price down 3.41%, the pattern implies June 2026 favored promotional or value-driven volume in core categories while niche formats rebounded sequentially off a low base.
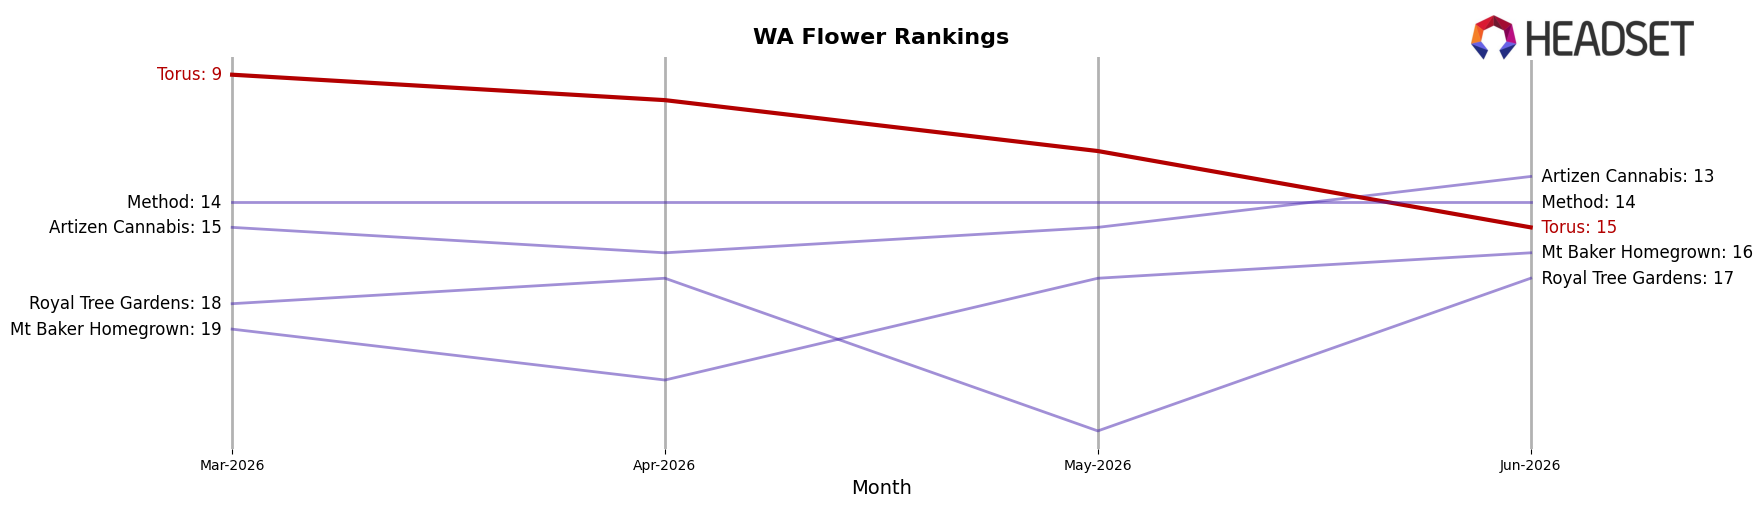
Torus’s mix leans toward budget-accessible formats—Pre-Roll average price at $9.07 and Flower at $24.76—pointing to a value anchor that gained YoY share in June 2026 despite MoM pullbacks, while higher-ticket Concentrates ($34.42) and Vapor Pens ($30.73) provided volatility and short-cycle upside. Coupled with a Flower rank of 15 in Washington, the divergence suggests room to trade consumers up within Flower and Pre-Roll without abandoning price-sensitive anchors, using the MoM momentum in Vapor Pens (+29.94%) and Concentrates (+23.26%) as test beds for premiumization that does not erode the 94.52% of sales concentrated in the two core categories.
Competitive Landscape
Torus sits at rank #15 in WA Flower in June 2026, down 2 positions year over year from #13 and 6 spots below its March-to-June slide from a #9 position three months ago; the brand is also 7 places off its #8 peak set in February 2026, indicating a multi-month descent. In contrast, Lifted Cannabis Co rose from #8 to #3 with a 17.9% year-over-year sales increase, while Sweetwater Farms advanced from #17 to #5 alongside a 65.8% year-over-year lift, and Phat Panda held #1 with a 16.6% gain; by comparison, Legends stayed at #2 despite a 19.8% decline, showing that rank mobility is being driven by growth concentration at the top. The pattern implies Torus’s rank trajectory is negatively diverging from upward movers and even stable leaders, so without reversing the 6-place retreat since March 2026 and closing the 7-rank gap to its February 2026 peak, competitive share will continue to consolidate above it.
Notable Products
Mint Milkshake (3.5g) logged the steepest movement in June 2026 with a -49.6% month-over-month drop while sitting at rank 4, contrasting with White Lobster (3.5g) at rank 1 and Mint Milkshake Pre-Roll 2-Pack (1g) at a shared rank 5 posting a -41.1% decline. Flower SKUs occupy 4 of the top 10 while Pre-Rolls hold 5 of the top 10, and White Lobster (3.5g) alone delivered $40,028 as the category anchor. The combined pullback in Mint Milkshake formats alongside a stable Flower-led ranking implies a recalibration toward flagship Flower potency over flavor extensions in the near term.
Top Selling Cannabis Brands
Data for this report comes from real-time sales reporting by participating cannabis retailers via their point-of-sale systems, which are linked up with Headset’s business intelligence software. Headset’s data is very reliable, as it comes digitally direct from our partner retailers. However, the potential does exist for misreporting in the instance of duplicates, incorrectly classified products, inaccurate entry of products into point-of-sale systems, or even simple human error at the point of purchase. Thus, there is a slight margin of error to consider. Brands listed on this page are ranked in the top twenty within the market and product category by total retail sales volume.

