Jun-2026
Sales
Trend
6-Month
Product Count
SKUs
Avg Price
YoY Sales Change
YoY Price Change
Market Insights Snapshot
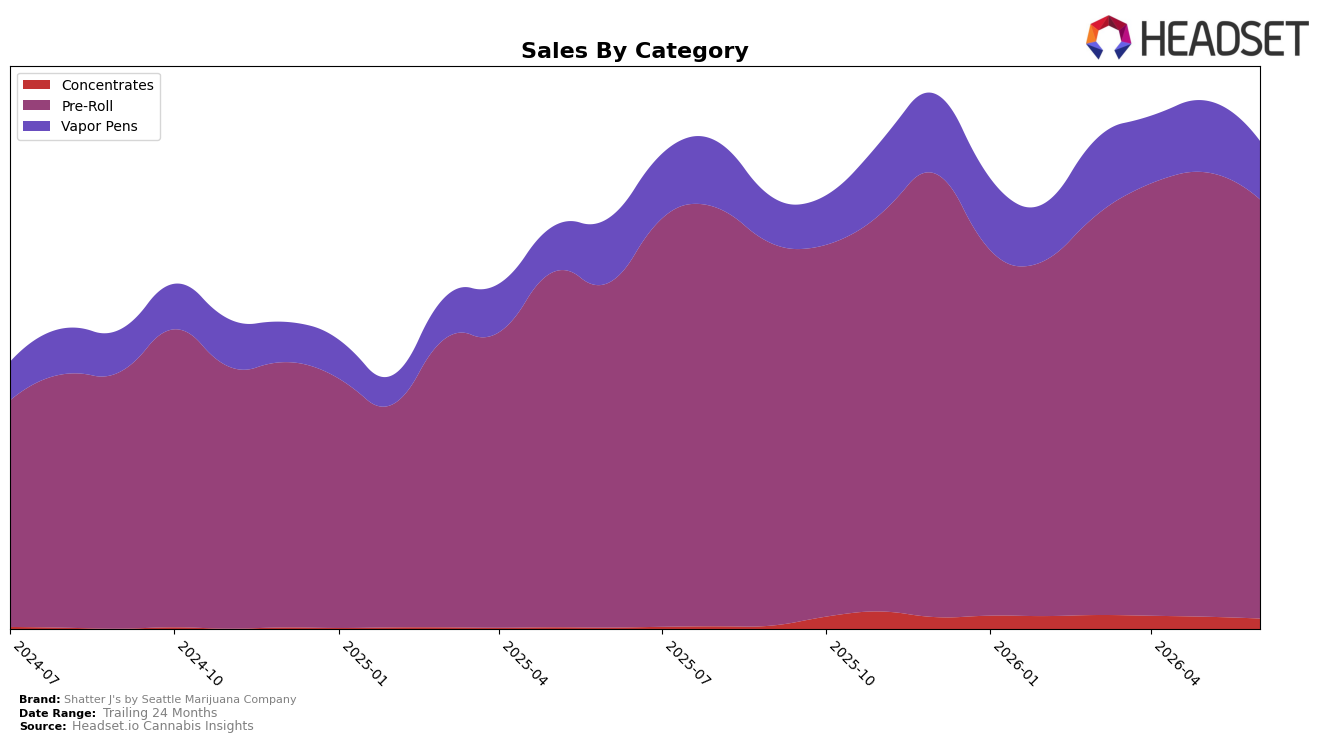
In June 2026, Pre-Roll held 85.99% share with 21.65% YoY growth but a -5.72% MoM dip, while Vapor Pens accounted for 11.93% share with -9.55% YoY and -18.59% MoM, and Concentrates reached 2.08% share with 835.76% YoY on a -15.37% MoM pullback. The brand’s average price rose 6.14% YoY to $11.06 even as Pre-Roll’s average price sat lower at $10.24, implying mix and pricing effects; together, the pattern points to a Pre-Roll-led portfolio that is growing YoY but softening MoM due to sequential declines in all three categories, especially Vapor Pens at -18.59% MoM.
With Pre-Roll ranked 17 in Washington and holding 85.99% of sales, the current mix concentrates exposure in a single category where MoM slipped -5.72% even as YoY rose 21.65%, signaling reliance on an anchor segment that can lift annual comps but amplify monthly volatility. The 835.76% YoY surge in Concentrates from a 2.08% share base and the -9.55% YoY drag in 11.93%-share Vapor Pens suggest early-stage experimentation alongside contraction, implying that near-term positioning hinges on defending Pre-Roll rank while selectively scaling Concentrates to diversify away from the Vapor Pens decline and dampen sequential swings.
Competitive Landscape
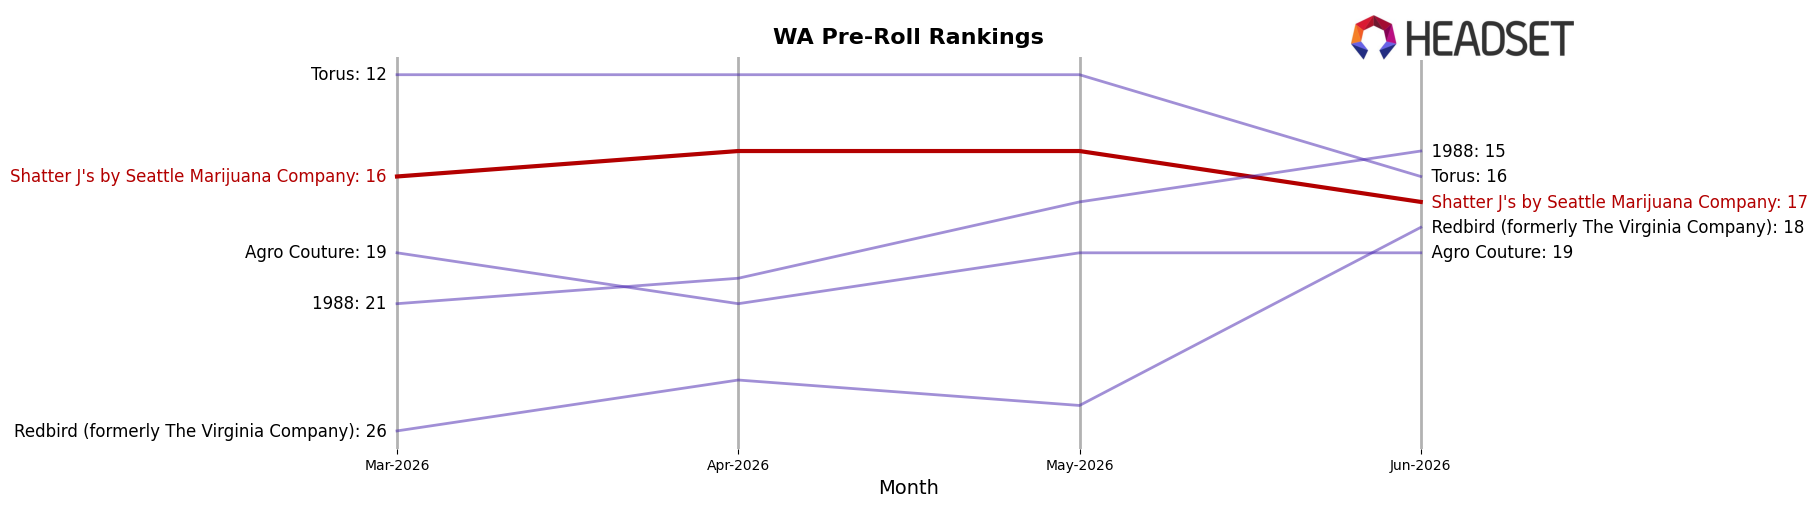
Shatter J's by Seattle Marijuana Company sits at rank #17 in WA Pre-Roll in June 2026, improving 5 positions year over year from #22, but slipping 1 place from March 2026’s #16 after peaking at #15 in May 2026; meanwhile, Ooowee advanced from #2 to #1 with 68.9% YoY sales growth and Lifted Cannabis Co climbed from #6 to #4 with 16.8% YoY growth, indicating that mid-tier gains for Shatter J's are being outpaced by faster-rising leaders. The pattern of a 5-rank YoY climb alongside a 1-rank quarter-over-quarter dip implies that Shatter J's has momentum but must convert brief peaks into sustained top-15 presence to avoid being boxed out by accelerating competitors.
Notable Products
Melon Guava Infused Pre-Roll (1g) posted the steepest movement in June 2026 with a -19.7% month-over-month drop while holding rank 2, contrasting with Blackberry Pie Shatter & Distillate Infused Pre-Roll (1g) up 8.6% at rank 1. Blueberry Shatter & Distillate Infused Pre-Roll (1g) climbed 14.7% to rank 3, whereas Pina Colada Infused Pre-Roll (1g) slid -10.7% at rank 6. With all ten top SKUs in the Pre-Roll category and only one product above $11,000 in sales, the mix signals reliance on a few flavor-led leaders and vulnerability to sharp swings in mid-pack variants, implying the brand is consolidating around top-ranked infused pre-rolls rather than broadening format diversity.
Top Selling Cannabis Brands
Data for this report comes from real-time sales reporting by participating cannabis retailers via their point-of-sale systems, which are linked up with Headset’s business intelligence software. Headset’s data is very reliable, as it comes digitally direct from our partner retailers. However, the potential does exist for misreporting in the instance of duplicates, incorrectly classified products, inaccurate entry of products into point-of-sale systems, or even simple human error at the point of purchase. Thus, there is a slight margin of error to consider. Brands listed on this page are ranked in the top twenty within the market and product category by total retail sales volume.

