.svg)

Sep-2026
Sales
Trend
6-Month
Product Count
SKUs
Avg Price
YoY Sales Change
YoY Price Change


Where to Buy
A1 Ducksauce is stocked at 25 licensed dispensaries across New York, with the deepest coverage in Brooklyn, New York, Queens, Staten Island, and Buffalo. Search by ZIP code or city below to find the closest one, or filter by product type if you are after a specific format.
Market Insights Snapshot
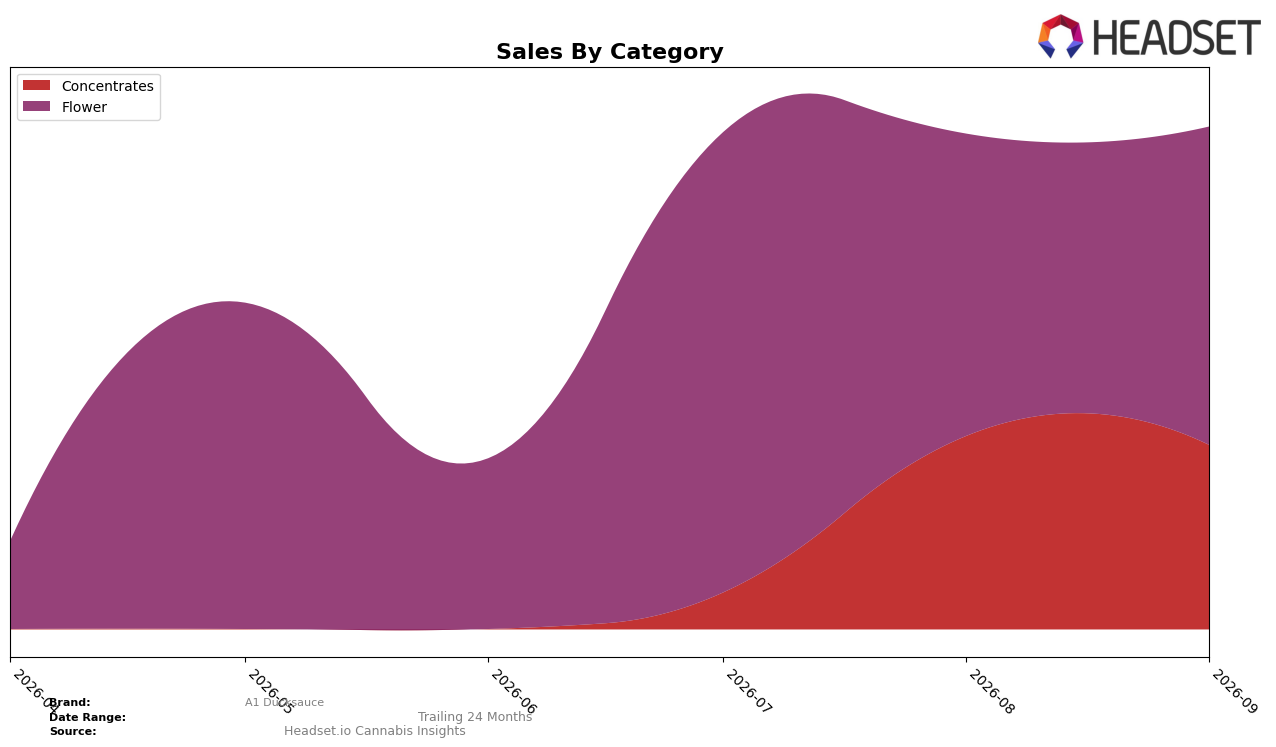
In September 2026, A1 Ducksauce concentrated 63.35% of sales in Flower and 36.65% in Concentrates, with Flower moving up month over month by 5.39% while Concentrates declined by 4.72%; that split places Flower as the principal revenue engine even as average prices diverged at $49.45 in Flower versus $51.82 in Concentrates. Within New York Flower, the brand sat at rank 78, indicating mid-pack visibility relative to the category despite a rising Flower contribution and a simultaneous pullback in Concentrates. The pattern implies A1 Ducksauce is leaning into Flower gains to compensate for Concentrates softness, using a lower Flower price point versus Concentrates to capture share while holding a mid-tier shelf position at rank 78.
The September 2026 mix shift—5.39% month-over-month expansion in Flower against a 4.72% contraction in Concentrates—repositions A1 Ducksauce toward a value-accessible Flower proposition at $49.45 that can widen baskets without relying on higher-priced Concentrates at $51.82, with a 63.35% Flower share creating scale to support awareness at rank 78. With 36.65% of sales still in Concentrates, a continued 4.72% monthly decline would progressively compress category diversification, so the brand’s near-term positioning hinges on sustaining Flower momentum while selectively stabilizing Concentrates to avoid overexposure to a single category.
Competitive Landscape
A1 Ducksauce sits at rank #78 in New York Flower in September 2026, with no year-over-year rank available, but it improved 44 positions from #122 in June 2026 and remains 13 spots below its peak of #65 in July 2026; compared with competitors, Find. holds #1 after a year-over-year move of 5 ranks and 16.2% sales growth, while Grassroots sits at #2 after a 15-rank climb and 150.3% YoY sales growth, indicating A1 Ducksauce’s mid-summer spike did not translate into top-tier persistence and that recent momentum is catch-up rather than share capture.

Notable Products
Matcha Jelly Rolls (3.5g) posted the steepest decline at -26.2% MoM and slid to rank 4, while Pina Colada Live Rosin (1g) fell -15.6% and sits at rank 5, indicating a pullback in two previously central SKUs. In contrast, Summer Breeze (3.5g) climbed +30.8% to rank 1 and Yum Yum Munchie Mania (3.5g) rose +30.5% to rank 3, and four of the top ten are Flower SKUs concentrated in ranks 1, 2, 3, and 4. With Concentrates posting mixed results — Wasabi Live Rosin (1g) up +21.8% to rank 9 versus Ducksauce Live Rosin (1g) down -3.4% at rank 8 — the product mix signals a pivot toward Flower-led momentum with selective Concentrates support, implying near-term merchandising should prioritize high-velocity Flower while triaging underperforming Concentrates.
Top Selling Cannabis Brands






Data for this report comes from real-time sales reporting by participating cannabis retailers via their point-of-sale systems, which are linked up with Headset’s business intelligence software. Headset’s data is very reliable, as it comes digitally direct from our partner retailers. However, the potential does exist for misreporting in the instance of duplicates, incorrectly classified products, inaccurate entry of products into point-of-sale systems, or even simple human error at the point of purchase. Thus, there is a slight margin of error to consider. Brands listed on this page are ranked in the top twenty within the market and product category by total retail sales volume.

