Jun-2026
Sales
Trend
6-Month
Product Count
SKUs
Avg Price
YoY Sales Change
YoY Price Change
Market Insights Snapshot
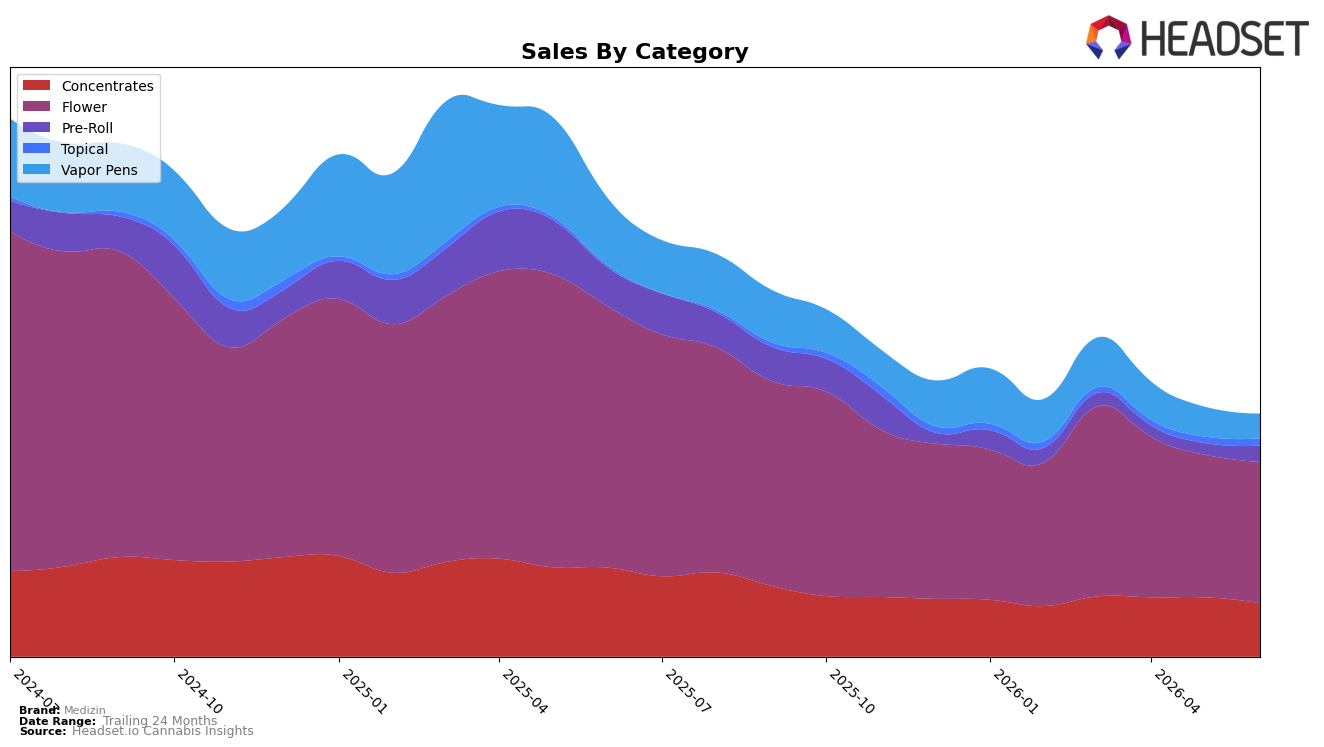
In June 2026, Medizin’s mix concentrated further in Flower at 53.16% share, yet Flower volume contracted with year-over-year sales down 44.63% and month-over-month down 0.77%, while Vapor Pens shed share to 11.45% alongside a 56.90% YoY decline and a 13.94% MoM drop. Counterbalancing, Pre-Roll grew MoM by 24.87% despite a 48.38% YoY decline, and Topical expanded 54.85% YoY with a 5.91% MoM lift to 5.19% share; Concentrates held 21.73% share but fell 36.97% YoY and 8.98% MoM. Given an average price up 7.75% YoY to $20.70, the category pattern implies Medizin is leaning on higher-priced formats (e.g., Topical at a $48.91 average) to offset broad volume pressure, but the dominance of shrinking Flower and Vapor Pens caps overall recovery.
Positionally, a Flower-heavy portfolio at 53.16% share tied to a 44.63% YoY contraction, coupled with Vapor Pens down 56.90% YoY, indicates Medizin’s core is overexposed to declining segments while its resilient pockets are smaller: Topical at 5.19% share with 54.85% YoY growth and Pre-Roll at 8.48% share with 24.87% MoM momentum. With Concentrates at 21.73% share still declining 8.98% MoM and the brand’s Flower rank at 7 in Nevada, the mix suggests a mid-tier positioning where stabilizing share likely requires either expanding the faster-growing Pre-Roll/Topical set or repositioning price/assortment in Flower to defend rank while margin is supported by formats sustaining higher average prices.
Competitive Landscape
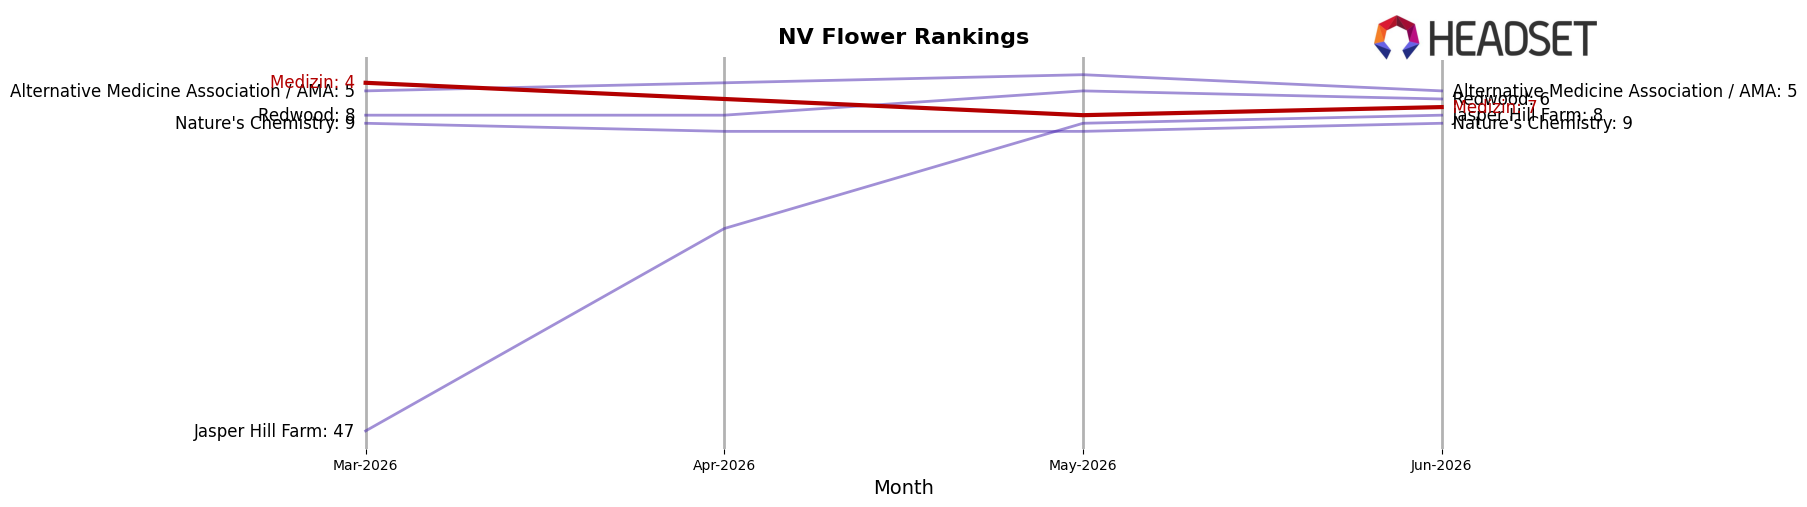
Medizin sits at rank #7 in NV Flower for June 2026, down 5 spots from rank #2 in June 2025 and 3 spots from rank #4 in March 2026, while the category leader STIIIZY holds #1 with a 1-position YoY gain and RYTHM is #2 with a 4-position YoY climb despite a -6.9% YoY sales change; by contrast, Medizin’s slide from a peak of #2 in June 2025 to #7 now coincides with FloraVega / Welleaf jumping 22 ranks YoY to #3 on roughly +260.4% YoY sales and Good Green holding #4 despite a -22.0% YoY sales decline. The combination of a 5-rank YoY drop and a 3-rank quarter-over-quarter decline implies that Medizin’s share of shelf is being redistributed toward faster-moving entrants and stable incumbents, and the trajectory points to a competitive displacement risk if mix or distribution is not recalibrated.
Notable Products
Cap Junky (3.5g) posted the largest movement in June 2026 with a +67% month-over-month surge to rank 3, while Orange Push Pop (3.5g) jumped +50% to rank 1, indicating momentum is consolidating at the very top of the list. Gastro Pop (3.5g) advanced +40% at rank 4 as Piescream (3.5g) barely moved at +1.9% at rank 10, and eight of the top ten are Flower SKUs, pointing to a category-heavy slate that concentrates demand in a few fast-climbing eighths. With two Flower SKUs gaining 40–67% while Pre-Roll entries sit lower at ranks 6 and 8, the mix implies Medizin is leaning into flagship Flower lifts rather than broadening across form factors, a path that favors depth in winning strains over portfolio balance.
Top Selling Cannabis Brands
Data for this report comes from real-time sales reporting by participating cannabis retailers via their point-of-sale systems, which are linked up with Headset’s business intelligence software. Headset’s data is very reliable, as it comes digitally direct from our partner retailers. However, the potential does exist for misreporting in the instance of duplicates, incorrectly classified products, inaccurate entry of products into point-of-sale systems, or even simple human error at the point of purchase. Thus, there is a slight margin of error to consider. Brands listed on this page are ranked in the top twenty within the market and product category by total retail sales volume.

