.svg)
Sep-2026
Sales
Trend
6-Month
Product Count
SKUs
Avg Price
YoY Sales Change
YoY Price Change


Where to Buy
AO Extracts is stocked at 58 licensed dispensaries across Colorado, with the deepest coverage in Denver, Colorado Springs, Fort Collins, Grand Junction, and Littleton. Search by ZIP code or city below to find the closest one, or filter by product type if you are after a specific format.
Market Insights Snapshot
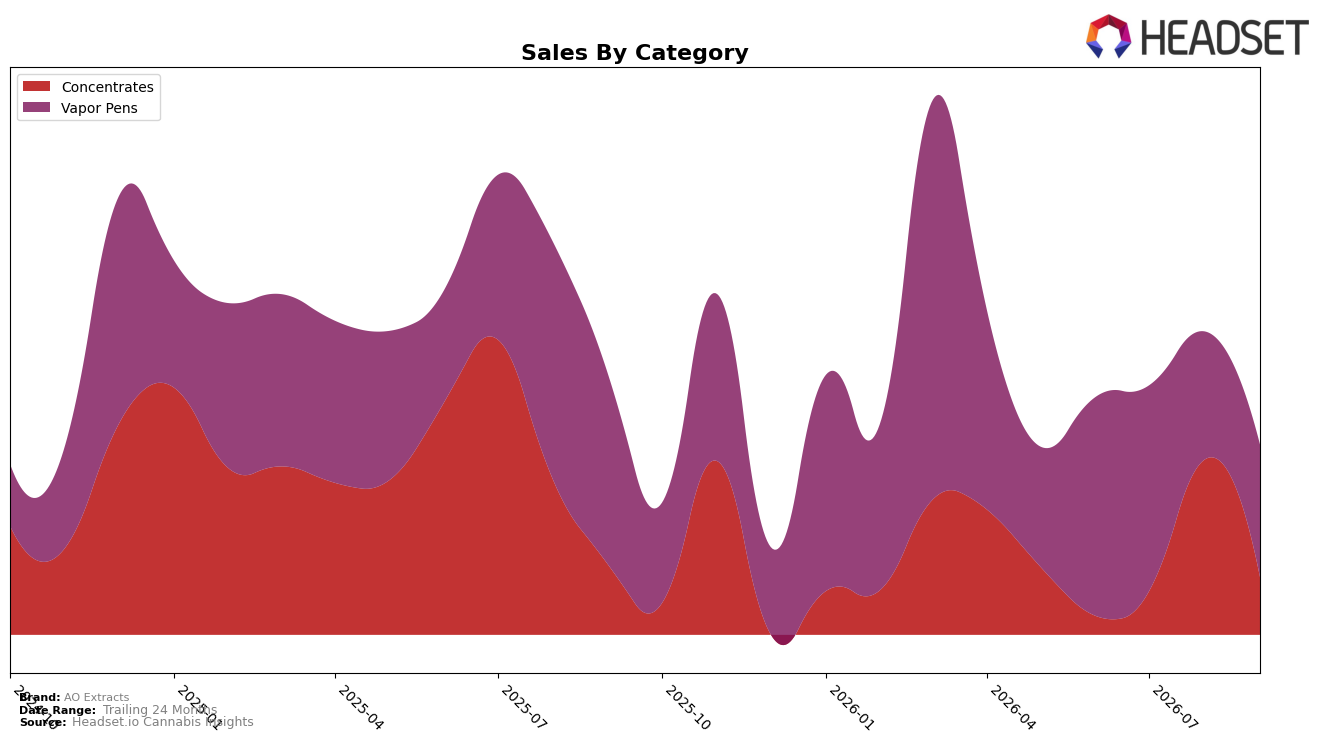
AO Extracts concentrated over half of September 2026 sales in Vapor Pens at 56.76% share, where year-over-year sales fell 15.47% but month-over-month ticked up 1.42%, while Concentrates held 43.24% share with a milder 4.83% year-over-year decline but a steep 32.93% month-over-month drop; the brand’s overall average price was down 12.47% year-over-year alongside an 11.18% brand-level sales decline, and the category price points sat near parity at $15.33 for Vapor Pens versus $15.85 for Concentrates. With Vapor Pens ranked 35 in Colorado, this mix suggests a pivot toward defending volume in Vapor Pens via lower pricing and incremental monthly gains while absorbing short-term volatility in Concentrates, implying a deliberate trade-off to stabilize total sell-through.
The divergent trajectories—Vapor Pens posting a 1.42% month-over-month lift against a 32.93% month-over-month contraction in Concentrates—imply that AO Extracts’ near-term positioning is shifting toward high-frequency, lower-price Vapor Pens to anchor shelf presence, even as year-over-year headwinds of 15.47% in that category cap upside. Given the brand’s 19.75% two-year sales growth alongside a 12.47% year-over-year price reduction, the pattern implies a value-led stance designed to protect rank in Colorado Vapor Pens at position 35 while accepting reduced Concentrates exposure to limit inventory risk and smooth demand variability.
Competitive Landscape
AO Extracts sits at rank #35 in CO Vapor Pens in September 2026, slipping 1 position year over year from #34, while improving 1 spot versus June 2026 from #36; this contrasts with PAX moving up from #3 to #2 and posting a 34.7% YoY sales increase, and Jetty Extracts rising from #15 to #4 alongside a 150.9% YoY gain. Despite a historical peak at #25 in March 2026 that is 10 ranks higher than today, AO Extracts’ current placement trails Spherex holding #1 with a 1.9% YoY lift and Green Dot Labs at #5 with 64.0% YoY growth, indicating AO Extracts is being outpaced at both the top tier and among fast risers; the trajectory from #25 in March 2026 to #35 in September 2026, alongside competitors’ double-digit gains, implies AO Extracts’ share is being diluted unless mix, pricing, or activation shifts reverse the rank erosion.

Notable Products
Blackberry Distillate Cartridge (1g) posted the largest month-over-month jump at +57.98% to rank 1, while Watermelon Distillate Cartridge (1g) fell -48.27% at rank 10, marking a widening spread between winners and laggards. Grape Runtz Distillate Cartridge (1g) slid -34.91% at rank 2 as Strawberry Jam Distillate Cartridge (1g) dropped -33.90% at rank 4, concentrating downside risk near the top of the chart. With eight of the top ten in Vapor Pens and the lead SKU expanding while peers contract, the mix points to a tilt toward a few flavor-led pen winners rather than broad-line momentum.
Top Selling Cannabis Brands






Data for this report comes from real-time sales reporting by participating cannabis retailers via their point-of-sale systems, which are linked up with Headset’s business intelligence software. Headset’s data is very reliable, as it comes digitally direct from our partner retailers. However, the potential does exist for misreporting in the instance of duplicates, incorrectly classified products, inaccurate entry of products into point-of-sale systems, or even simple human error at the point of purchase. Thus, there is a slight margin of error to consider. Brands listed on this page are ranked in the top twenty within the market and product category by total retail sales volume.

