.svg)
Jul-2026
Sales
Trend
6-Month
Product Count
SKUs
Avg Price
YoY Sales Change
YoY Price Change


Market Insights Snapshot
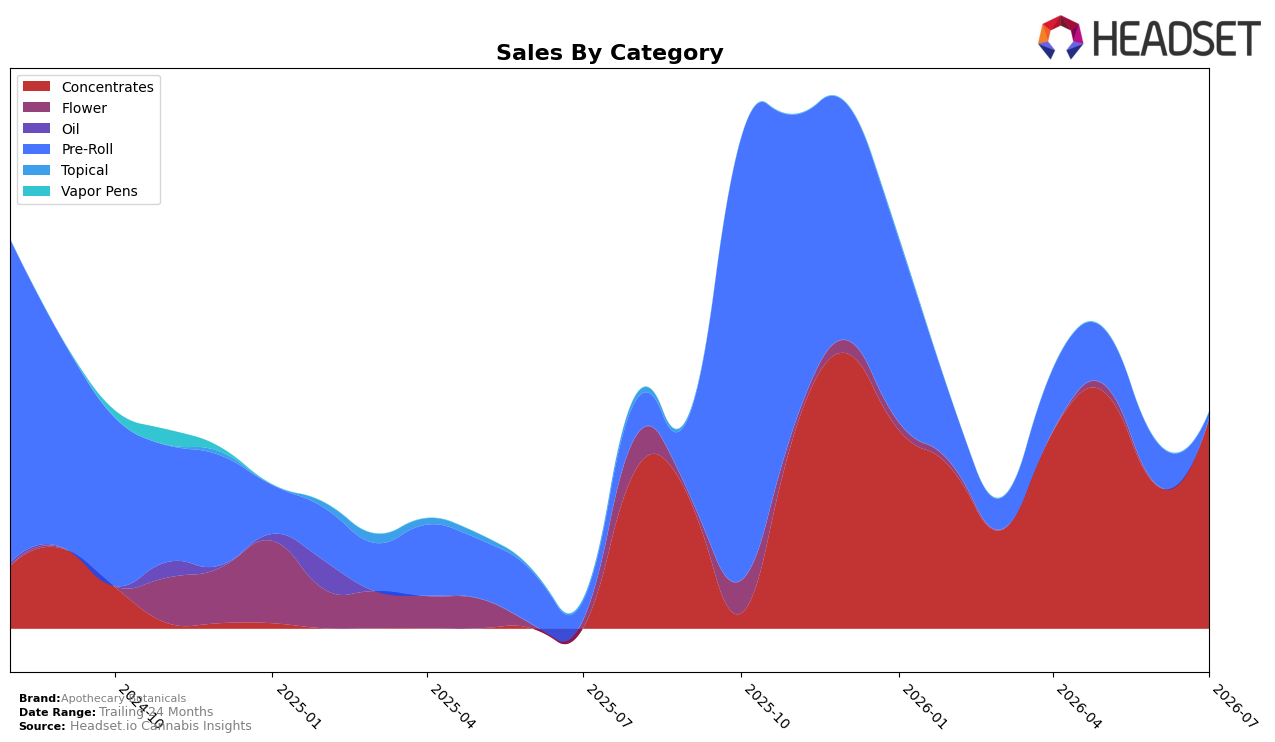
Apothecary Botanicals concentrated its July 2026 sales in Concentrates with a 97.34% share while Pre-Roll fell to 2.66%, a mix that coincides with a 47.28% month-over-month lift in Concentrates and an 86.37% month-over-month drop in Pre-Roll. Year over year, Pre-Roll declined 69.26% even as overall brand sales rose 679.90%, and the average price rose 4.94% to $25.28, indicating the surge was volume-led in Concentrates rather than price-led. The brand sat at rank 35 in Concentrates in British Columbia, which alongside a 97.34% category share implies a deliberate pivot away from breadth toward depth in a single category.
The category consolidation suggests positioning as a Concentrates specialist in British Columbia, where rank 35 leaves headroom to gain share if the 47.28% month-over-month trajectory persists and price stays near the $25.12 Concentrates average. With Pre-Roll shrinking 69.26% year over year and 86.37% month over month to just 2.66% of mix, the brand’s exposure to a single category concentrates performance risk but also focuses merchandising, pricing, and product development around a segment where July 2026 momentum was positive; the thesis is that maintaining this narrow focus can trade volatility in secondary categories for clearer execution against a mid-pack rank.
Competitive Landscape
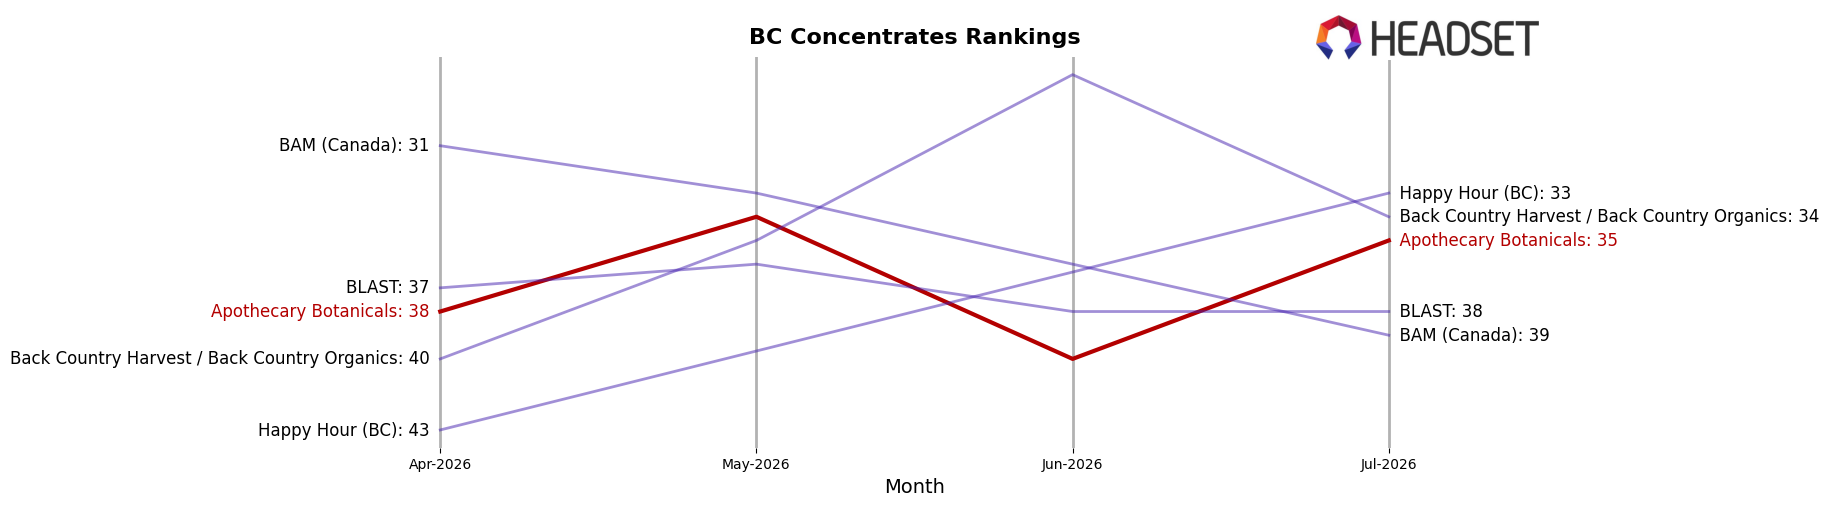
Apothecary Botanicals sits at rank #35 in BC Concentrates for July 2026, improving 3 positions from #38 in April 2026 while remaining 1 spot off its peak of #34 from May 2026; this modest climb contrasts with BoxHot rising to #3 from #8 year over year with 98.6% sales growth and Vortex Cannabis Inc. holding #2 despite a 27.5% YoY sales decline. The category leader Endgame is #1 with a 9.5% YoY sales contraction while Dab Bods stays at #4 with 17.6% YoY growth, indicating Apothecary Botanicals’ rank gains are incremental relative to competitors moving multiple ranks and double-digit percentages; the trajectory implies share is stabilizing rather than breaking into the top tier unless rank velocity exceeds 3 positions per quarter.
Notable Products
Midnight Kruntz Pre-Roll 10-Pack (5g) led the movement with a -27% month-over-month decline to rank 2, while The Du-O Flower Rosin 2-Pack (1g) rose +47% month-over-month to hold rank 1, concentrating revenue in a single Concentrates SKU. Two Pre-Roll SKUs remain in the top two ranks but only one carries growth, and at least four of the top ten are Pre-Roll items, indicating a category presence that is sliding in momentum versus Concentrates.
The Du-O Flower Rosin 2-Pack (1g) accounted for the top spot with $17,288 and a +47% jump, outpacing the -27% drop for Midnight Kruntz Pre-Roll 10-Pack (5g) at rank 2, a spread that widens category dependence on a single concentrate. The pattern implies Apothecary Botanicals is tilting toward premium extracts for volume while Pre-Roll depth risks dilution unless pricing or strain refresh reverses the double-digit slide.
Top Selling Cannabis Brands






Data for this report comes from real-time sales reporting by participating cannabis retailers via their point-of-sale systems, which are linked up with Headset’s business intelligence software. Headset’s data is very reliable, as it comes digitally direct from our partner retailers. However, the potential does exist for misreporting in the instance of duplicates, incorrectly classified products, inaccurate entry of products into point-of-sale systems, or even simple human error at the point of purchase. Thus, there is a slight margin of error to consider. Brands listed on this page are ranked in the top twenty within the market and product category by total retail sales volume.

