.svg)

Sep-2026
Sales
Trend
6-Month
Product Count
SKUs
Avg Price
YoY Sales Change
YoY Price Change


Market Insights Snapshot
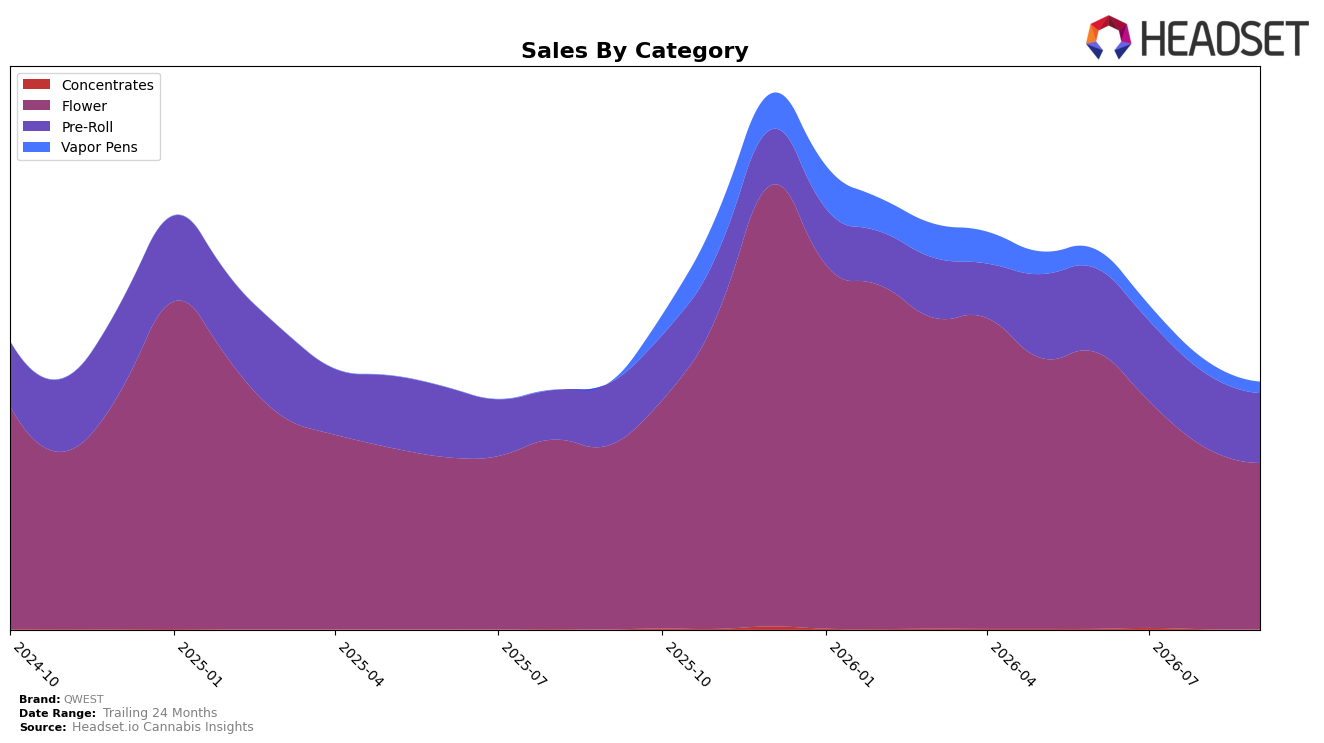
In September 2026, QWEST concentrated 67.36% share in Flower with year-over-year decline of 9.48% and month-over-month decline of 8.51%, while Pre-Roll rose 12.87% YoY but fell 6.43% MoM at a 28.16% mix; Vapor Pens held 4.48% share with a 12.87% MoM dip and no YoY baseline. Despite a 61.36% YoY lift in total brand sales alongside a 25.18% YoY drop in average price to $28.52, category momentum was mixed, and the Flower-heavy mix combined with concurrent MoM pullbacks across all three categories implies reliance on pricing elasticity rather than underlying unit demand growth in September 2026.
QWEST’s Flower rank at 19 in Saskatchewan within Flower, coupled with a 67.36% mix share and MoM declines of 8.51% in Flower and 6.43% in Pre-Roll, indicates positioning anchored in premium Flower pricing tiers that are being discounted while still lagging in velocity. With Pre-Roll gaining 12.87% YoY share momentum against a 6.43% MoM contraction and Vapor Pens shrinking 12.87% MoM at only 4.48% mix, the portfolio skew suggests the brand is over-indexed to Flower and under-scaled in Vapor Pens, implying near-term upside from rebalancing toward Pre-Roll while stabilizing Flower rank from 19 through price-pack architecture rather than further broad price cuts.
Competitive Landscape
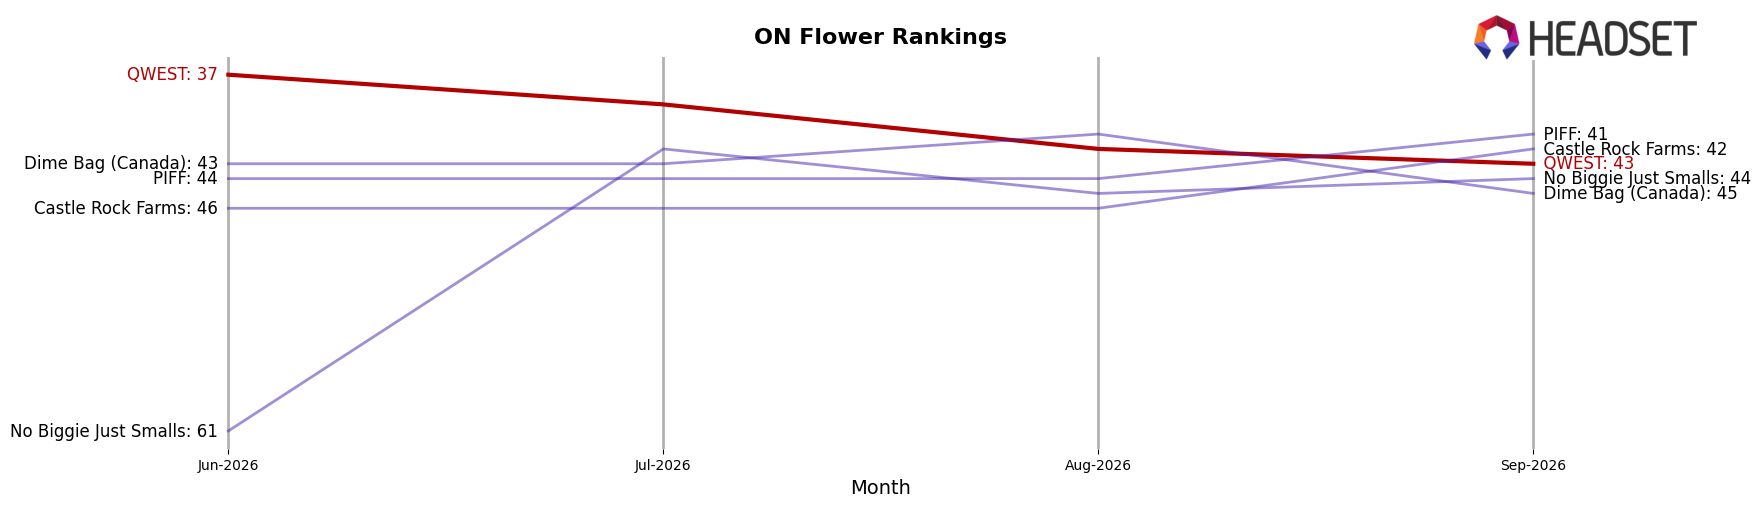
QWEST sits at rank #43 in September 2026, improving 27 positions from #70 year over year, yet slipping 6 spots from its June 2026 peak at #37 to #43 by September 2026; in contrast, Spinach moved up from #3 to #1 while growing sales 15.7% year over year, and Back Forty / Back 40 Cannabis fell from #1 to #3 with a 7.4% sales decline, indicating that QWEST’s climb is occurring amid leadership churn at the top and that its recent dip from #37 to #43 suggests momentum is fragile without a near-term catalyst.
Notable Products
Georgia Pie (7g) posted the steepest decline in September 2026 at -24.3%, dropping to rank 4 while White Walker #2 (7g) fell -28.8% to rank 8, signaling pressure within larger Flower formats. In contrast, Vision Pre-Roll 2-Pack (2g) rose 11.0% to rank 1 and Platinum Gas (7g) advanced 15.3% at rank 6, with four of the top ten being Flower SKUs against three Pre-Roll SKUs. Georgia Pie Pre-Roll 10-Pack (3.5g) also slid -35.4% at rank 10 while Georgia Pie Pre-Roll 5-Pack (2.5g) inched up 5.3% at rank 3, indicating pack-size sensitivity rather than strain fatigue. The pattern implies QWEST is tilting toward smaller, higher-velocity formats in Pre-Roll while rationalizing larger Flower offerings that are losing rank.
Top Selling Cannabis Brands






Data for this report comes from real-time sales reporting by participating cannabis retailers via their point-of-sale systems, which are linked up with Headset’s business intelligence software. Headset’s data is very reliable, as it comes digitally direct from our partner retailers. However, the potential does exist for misreporting in the instance of duplicates, incorrectly classified products, inaccurate entry of products into point-of-sale systems, or even simple human error at the point of purchase. Thus, there is a slight margin of error to consider. Brands listed on this page are ranked in the top twenty within the market and product category by total retail sales volume.

