Jun-2026
Sales
Trend
6-Month
Product Count
SKUs
Avg Price
YoY Sales Change
YoY Price Change
Market Insights Snapshot
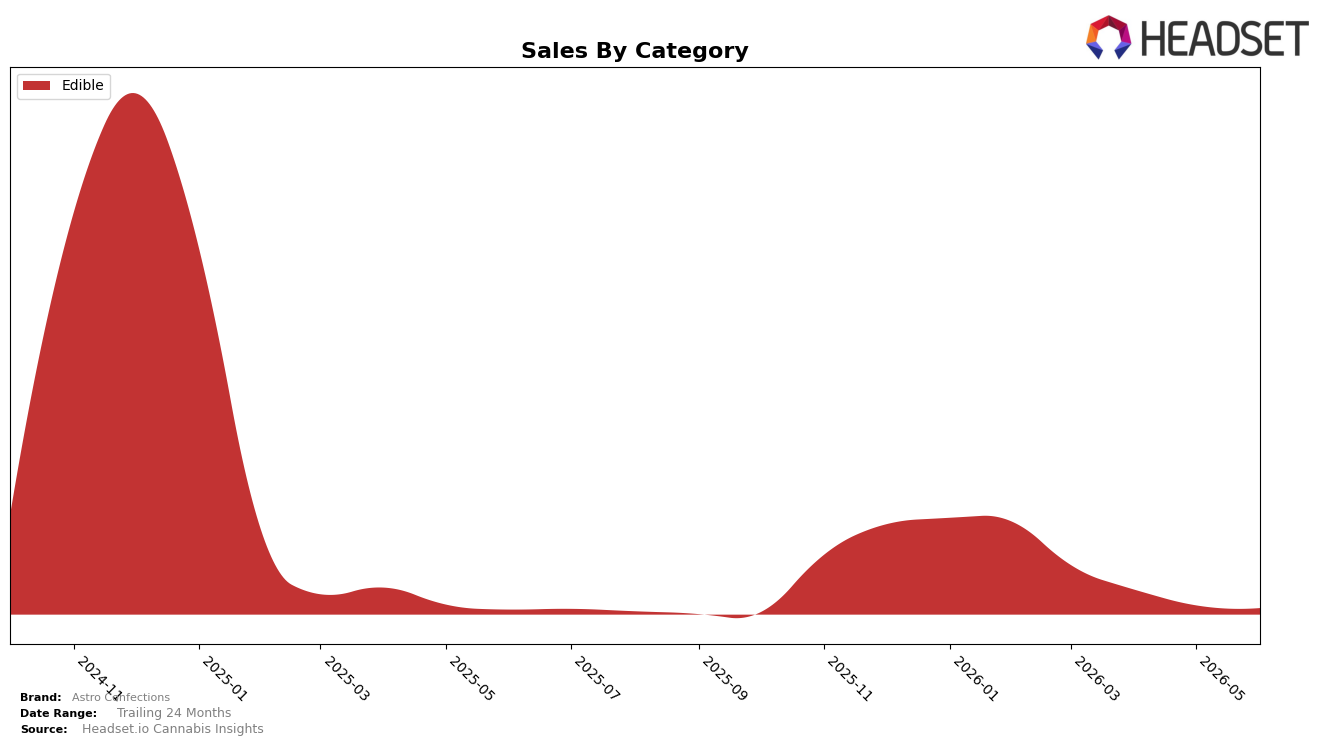
Astro Confections operated as a single-category brand in June 2026, with Edible holding 100.0% mix, posting 28.3% year-over-year growth alongside a 28.0% month-over-month decline, while average price fell 46.2% year over year and sat at $15.36. With no diversification beyond Edible and no June 2026 rank reported in Connecticut Edible, the juxtaposition of double-digit YoY sales growth and a sharp MoM pullback indicates demand momentum over a 12‑month window but exposure to short-term volatility within a single format and market.
The combination of a 100.0% Edible concentration and a 46.2% YoY price drop implies Astro Confections is leaning into price elasticity to capture volume, as evidenced by 28.3% YoY sales growth despite the 28.0% MoM contraction. The pattern suggests positioning as a value-forward Edible specialist rather than a portfolio balancer; sustaining share will likely hinge on stabilizing monthly sell-through in Connecticut and maintaining price architecture that converts traffic without requiring further discount-driven lifts.
Competitive Landscape
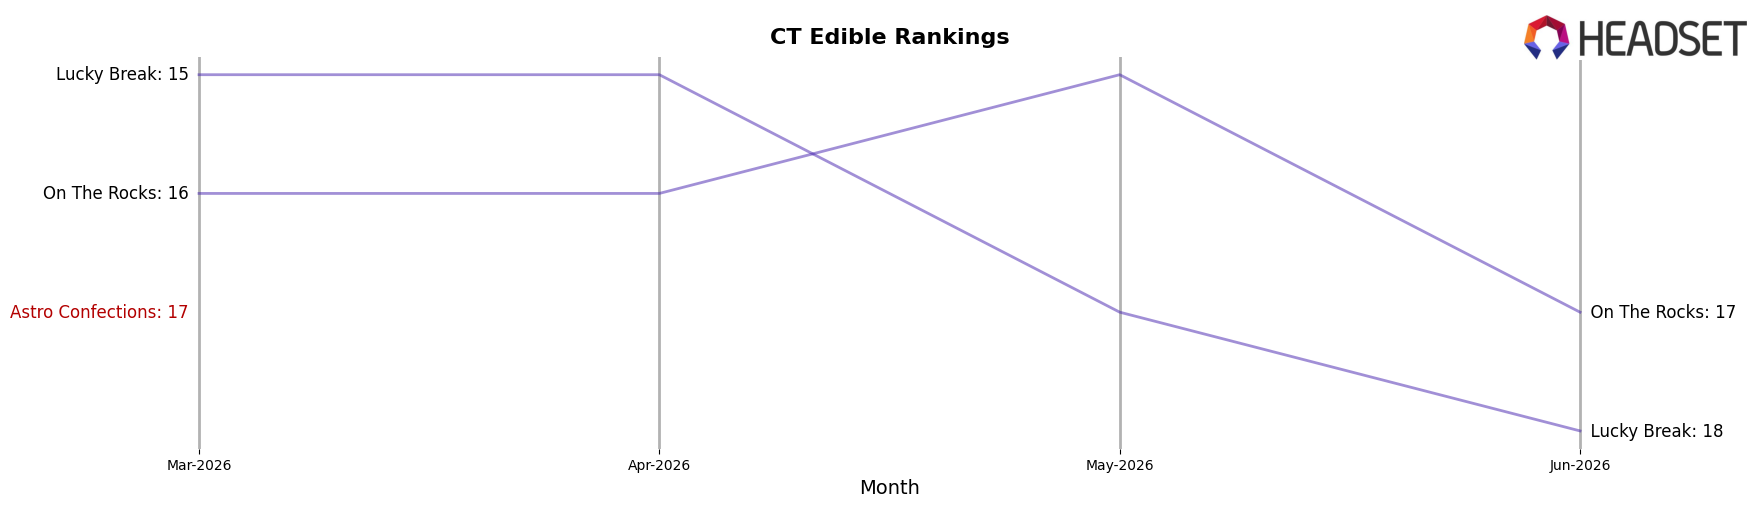
Astro Confections ranks #20 in CT Edible in June 2026, down 2 positions year over year from #18 and slipping 3 spots since March 2026 from #17, while its historical peak was #9 in December 2024; by contrast, Soundview moved from #2 to #1 and Camino climbed from #6 to #2 with a 289.8% year-over-year sales increase, indicating Astro Confections is losing relative placement as leaders consolidate share and accelerate above it. This rank drift against competitors advancing 1 to 4 places, combined with Astro Confections’ 11-position gap from its December 2024 peak, implies a transition from occasional top-10 relevance to mid-tier status unless assortment or velocity shifts reset trajectory.
Notable Products
Peanut Butter Milk Chocolate Cups 10-Pack (50mg) led June 2026 with a -28.0% month-over-month drop while holding rank 1, indicating volume concentration at the top despite contraction. With three other top SKUs absent from the ranking entirely in June 2026 and carrying no reported MoM change, the share of Edible items in the visible top set is effectively 100% but materially thinner in breadth. The combination of a -28.0% decline at rank 1 and multiple unranked 5-Pack and 10-Pack variants points to a pullback in multipack momentum. The pattern implies a consolidation phase in which Astro Confections leans on a single flagship while reevaluating pack-size variety to stabilize demand.
Top Selling Cannabis Brands
Data for this report comes from real-time sales reporting by participating cannabis retailers via their point-of-sale systems, which are linked up with Headset’s business intelligence software. Headset’s data is very reliable, as it comes digitally direct from our partner retailers. However, the potential does exist for misreporting in the instance of duplicates, incorrectly classified products, inaccurate entry of products into point-of-sale systems, or even simple human error at the point of purchase. Thus, there is a slight margin of error to consider. Brands listed on this page are ranked in the top twenty within the market and product category by total retail sales volume.

