.svg)

Sep-2026
Sales
Trend
6-Month
Product Count
SKUs
Avg Price
YoY Sales Change
YoY Price Change



Where to Buy
On The Rocks is stocked at 50 licensed dispensaries across Connecticut, New Jersey, and 4 other states, 20 of them in Connecticut, with the deepest coverage in Norwalk, Branford, Bristol, Canton, and Danbury. Search by ZIP code or city below to find the closest one, or filter by product type if you are after a specific format.
Market Insights Snapshot
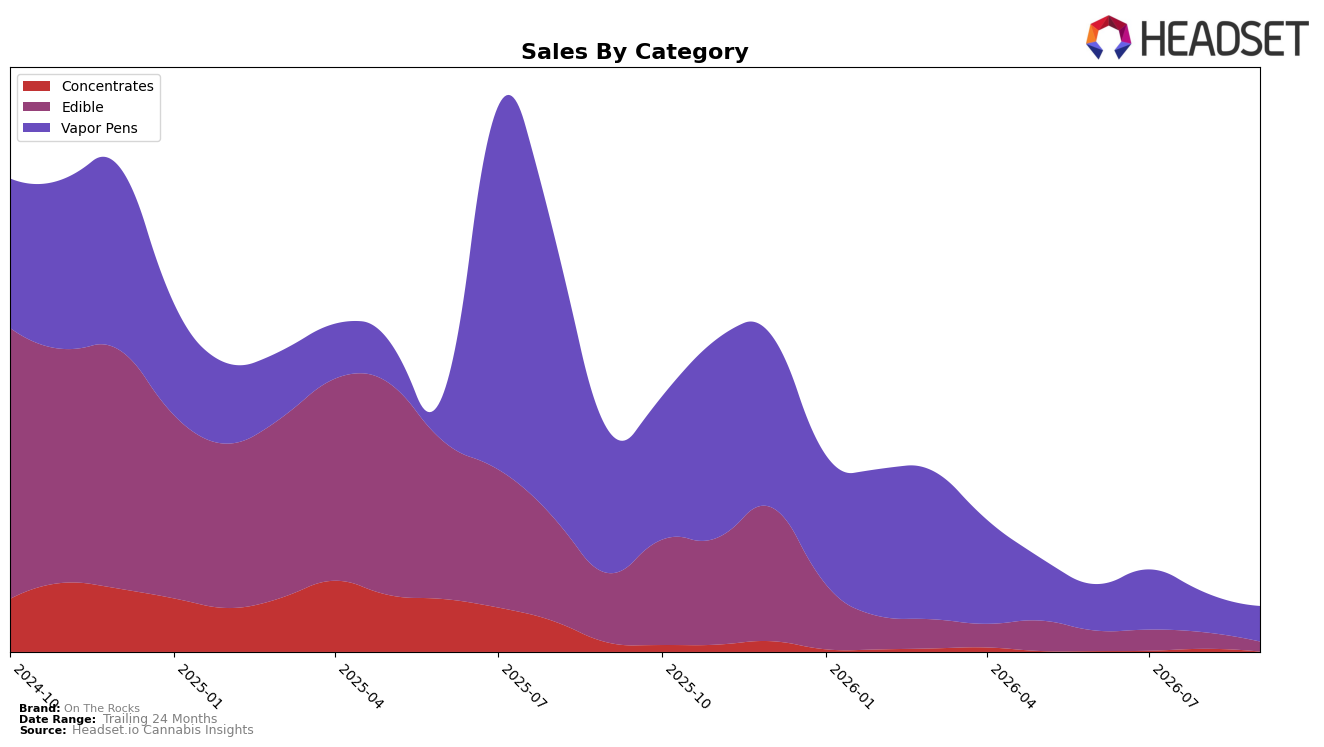
In September 2026, Vapor Pens accounted for 78.02% share with year-over-year down 75.19% and month-over-month down 11.15%, while Edible held 21.72% share with year-over-year down 85.82% and month-over-month down 39.58%; Concentrates fell to 0.26% share with year-over-year down 98.69% and month-over-month down 95.87%. The average price rose 2.40% year-over-year to $44.24 as overall brand sales declined 79.50% year-over-year, and the brand’s top state was Connecticut. Taken together, the heavier mix in Vapor Pens alongside sharper declines in Edible and Concentrates implies the portfolio has consolidated into one primary category while experiencing contraction across all lines.
Within Vapor Pens, where the brand ranked 26th in Connecticut, the 11.15% month-over-month decline versus Edible’s 39.58% and Concentrates’ 95.87% suggests relative stability in the core while peripheral categories retrench. The combination of a 2.40% year-over-year price increase and a 79.50% year-over-year sales decline signals demand elasticity pressure, implying that maintaining volume likely hinges on reinforcing the Vapor Pens position and rationalizing or repositioning Edible and Concentrates to reduce drag.
Competitive Landscape
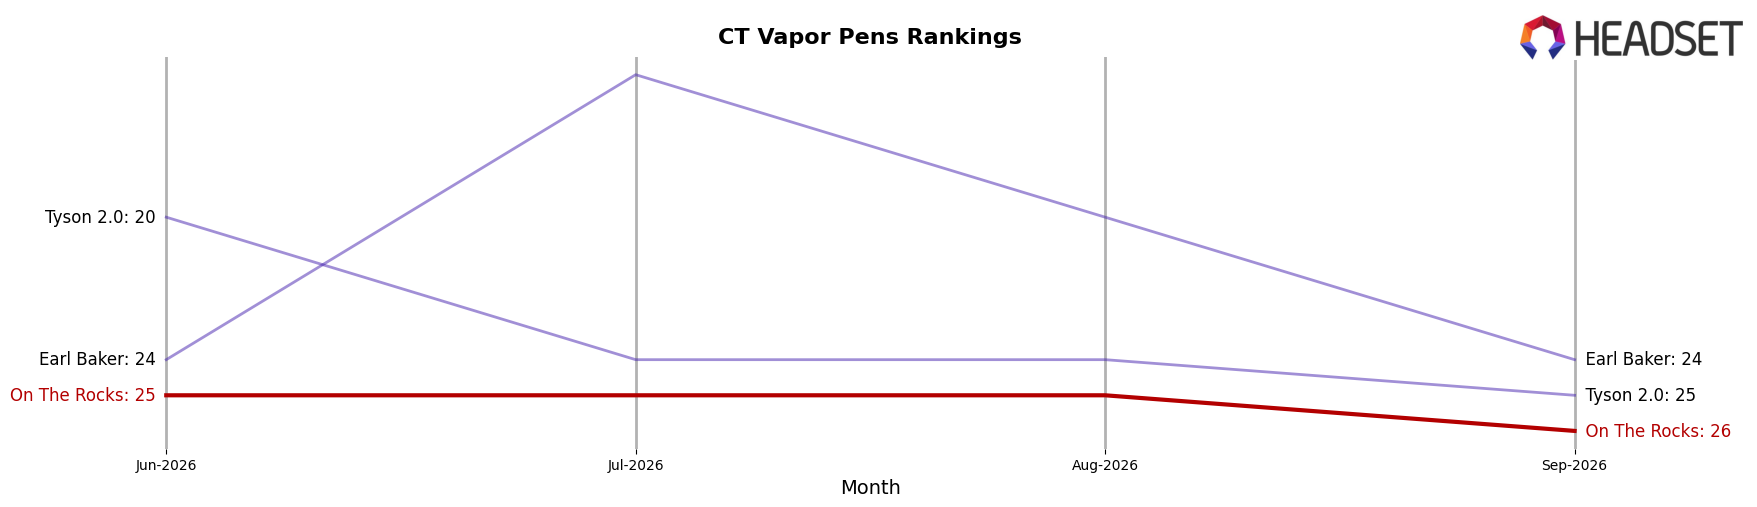
On The Rocks sits at rank #26 in CT Vapor Pens in September 2026, sliding 9 positions year over year from #17 while dipping 1 spot from June 2026’s #25, and it remains 13 places below its peak at #13 in July 2025, signaling a multi-quarter descent rather than a short-term wobble. In contrast, Select moved up to #1 from #3 year over year with 84% YoY sales growth, and Soundview advanced to #5 from #15 alongside 509% YoY sales growth, indicating that gains at the top end are outpacing On The Rocks’ share retention; the net effect is a widening competitive gap that implies On The Rocks’ rank trajectory is converging toward the lower tier unless mix or distribution shifts reverse the downward momentum.
Notable Products
Jokerz Live Rosin Disposable (1g) delivered the standout move with a 63.1% month-over-month lift into rank 3, while Gelato 41 Solventless Live Rosin Disposable (1g) plunged 62.9% to rank 7. Edibles held the top two ranks as Hybrid Peach Mango Flavored Live Rosin Gummies 20-Pack (100mg) rose 15.2% at rank 1 and Sour Apricot Apple Live Rosin Gummies 20-Pack (100mg) gained 14.2% at rank 2, indicating gummies still anchor the leaderboard. With Super Lemon G Live Rosin Disposable (1g) down 26.4% at rank 6 alongside the Gelato 41 drop, five of the top ten are Vapor Pens SKUs that are splitting momentum between one surge and two steep pullbacks, which implies On The Rocks is tilting its product mix toward live rosin inhalables but will need tighter SKU curation to avoid cannibalization.
Top Selling Cannabis Brands






Data for this report comes from real-time sales reporting by participating cannabis retailers via their point-of-sale systems, which are linked up with Headset’s business intelligence software. Headset’s data is very reliable, as it comes digitally direct from our partner retailers. However, the potential does exist for misreporting in the instance of duplicates, incorrectly classified products, inaccurate entry of products into point-of-sale systems, or even simple human error at the point of purchase. Thus, there is a slight margin of error to consider. Brands listed on this page are ranked in the top twenty within the market and product category by total retail sales volume.

