Jun-2026
Sales
Trend
6-Month
Product Count
SKUs
Avg Price
YoY Sales Change
YoY Price Change
Market Insights Snapshot
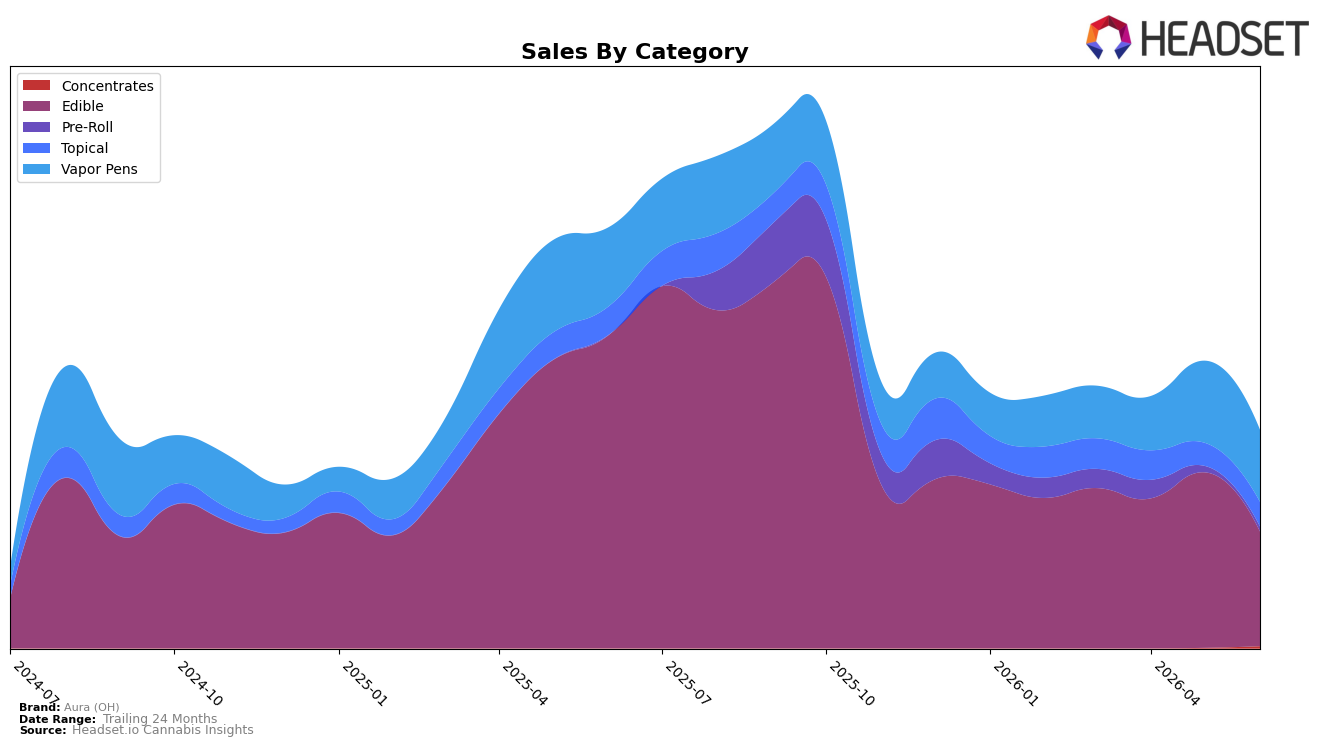
In June 2026, Aura (OH)'s mix tilted toward Edible at 52.6% share with a year-over-year decline of 63.4% and a month-over-month drop of 34.7%, while Vapor Pens held 33.0% share with a 9.1% YoY decline and a 12.3% MoM decline. Topical reached 11.2% share with a 13.1% YoY decline but a 7.3% MoM increase, contrasting with Pre-Roll at 2.1% share falling 24.2% MoM and Concentrates at 1.0% share surging 349.0% MoM from a small base. With brand sales down 48.2% YoY and average price down 35.1% YoY to $24.63, the pattern implies the core Edible franchise is compressing faster than the rest of the portfolio while small formats are testing volatility rather than offsetting the Edible-led contraction.
Given an Edible category rank of 19 in Ohio alongside a 63.4% YoY sales decline in Edible and only a 9.1% YoY decline in Vapor Pens, the portfolio is overweight to the weakest trajectory and underweight to the relatively steadier one. The 7.3% MoM lift in Topical amid a 12.3% MoM slide in Vapor Pens and a 34.7% MoM slide in Edible indicates shoppers are experimenting at the fringes while pulling back on core SKUs; combined with a 349.0% MoM spike in Concentrates from minimal share, the implication is that near-term positioning should pivot from Edible concentration toward stabilizing Vapor Pens and nurturing Topical as a defensive anchor rather than relying on transient Concentrates gains.
Competitive Landscape
Aura (OH) sits at rank #19 in June 2026, down 9 positions from its peak of #9 in July 2025 and down 9 positions versus its #10 spot one year ago, while also sliding 3 positions from #16 three months ago; by contrast, Incredibles held #1 year over year and remains #1, and Gron / Grön rose from #7 to #2 with 79.36% sales growth, indicating Aura (OH)’s relative rank erosion is tied less to category contraction and more to competitors’ outsized momentum, implying that without a targeted move on share, Aura (OH) is likely to continue ceding rank to faster-advancing leaders.

Notable Products
The Rook Entourage Distillate Ceramic Cartridge (1g) posted the steepest decline at -62.2% month over month and slipped to rank 3, while CBN/THC 1:1 Blue Raspberry Crunch Gummies 11-Pack (110mg CBN, 110mg THC) climbed 43.6% to rank 2; meanwhile, CBD/THC 1:1 Watermelon Seed Crunch Gummies 10-Pack (100mg CBD, 100mg THC) rose 44.4% at rank 4. Four of the top ten are Edible SKUs, and three are Vapor Pens, with Edibles showing two double-digit MoM gains against one double-digit decline in Edibles at -11.6% for Pink Lemonade, implying momentum is consolidating in functional gummies while inhalable demand softens. This mix suggests Aura (OH) is tilting toward multi-cannabinoid Edibles as the growth engine, reallocating focus from volatile pen SKUs toward formats with steadier MoM traction.
Top Selling Cannabis Brands
Data for this report comes from real-time sales reporting by participating cannabis retailers via their point-of-sale systems, which are linked up with Headset’s business intelligence software. Headset’s data is very reliable, as it comes digitally direct from our partner retailers. However, the potential does exist for misreporting in the instance of duplicates, incorrectly classified products, inaccurate entry of products into point-of-sale systems, or even simple human error at the point of purchase. Thus, there is a slight margin of error to consider. Brands listed on this page are ranked in the top twenty within the market and product category by total retail sales volume.

