.svg)

Aug-2026
Sales
Trend
6-Month
Product Count
SKUs
Avg Price
YoY Sales Change
YoY Price Change



Where to Buy
Theraplant is stocked at 50 licensed dispensaries across Connecticut, with the deepest coverage in Hamden, New Haven, Norwalk, West Hartford, and Bristol. Search by ZIP code or city below to find the closest one, or filter by product type if you are after a specific format.
Market Insights Snapshot
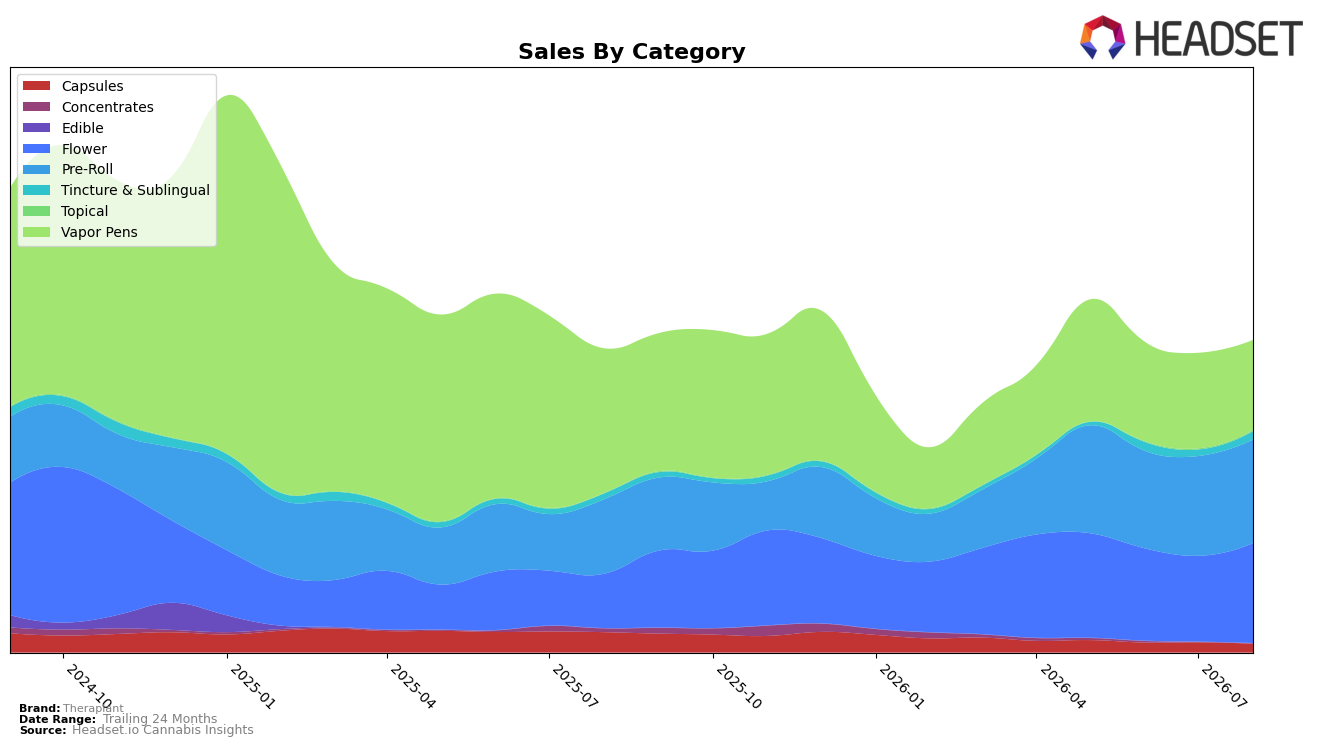
Theraplant’s August 2026 category mix leans on Pre-Roll at 33.29% share with year-over-year growth of 39.27% and month-over-month growth of 3.79%, while Flower sits close behind at 32.18% share with year-over-year growth of 84.73% and month-over-month growth of 16.73%. Vapor Pens has contracted to 28.93% share with a year-over-year decline of 37.81% and a month-over-month dip of 5.78%, and Capsules has narrowed to 2.72% share with a 58.09% year-over-year drop and a 15.22% month-over-month decline. Smaller lines are mixed: Tincture & Sublingual holds 2.61% share with a 47.48% year-over-year rise and a 30.77% month-over-month lift, while Topical at 0.24% share surged 266.90% year-over-year but slid 7.77% month-over-month; Concentrates contracted to 0.04% share with a 96.06% year-over-year decline and no measurable month-over-month read. This pattern indicates Theraplant is reallocating demand toward inhalables led by Pre-Roll and Flower while paring back Capsules and Concentrates, shifting the portfolio toward faster-turn formats that can absorb pricing pressure as the average price fell 12.57% year over year.
With Pre-Roll ranked 1 in Connecticut and Flower accelerating 84.73% year over year against a simultaneous 37.81% year-over-year decline in Vapor Pens, Theraplant’s positioning tilts toward value-accessible combustion products rather than device-dependent formats. The twin gains of Pre-Roll (3.79% month over month) and Flower (16.73% month over month) alongside a 30.77% month-over-month rise in Tincture & Sublingual imply basket substitution away from Capsules (down 15.22% month over month) and Vapor Pens (down 5.78% month over month) toward categories with lower switching costs at a time when average price is down 12.57% year over year. The implication is a portfolio strategy centered on defending and expanding share through lead categories where the brand already holds rank authority and price elasticity works in its favor, using Pre-Roll leadership to pull trial into Flower while deprioritizing Capsules and Concentrates that contribute minimal share at 2.72% and 0.04%, respectively.
Competitive Landscape
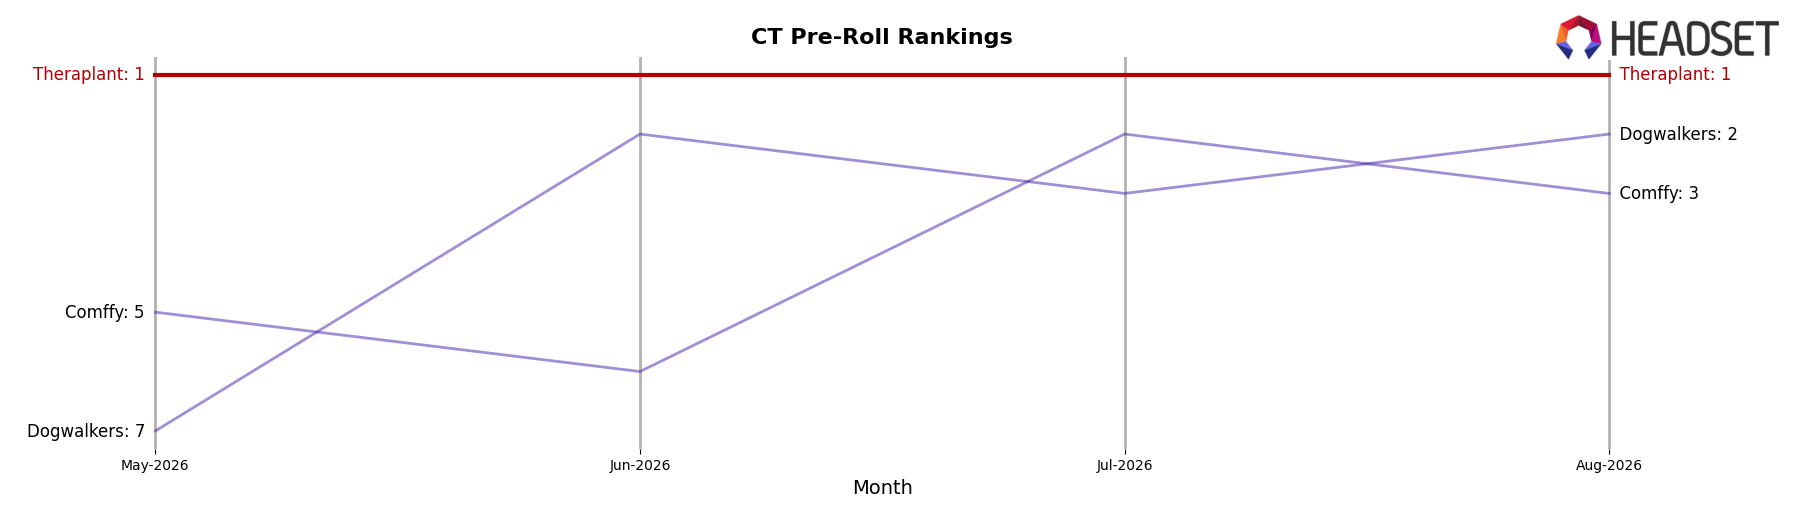
Theraplant ranks #1 in CT Pre-Roll in August 2026, improving 1 place YoY from #2 and holding #1 for 3 months after matching its peak in August 2026; meanwhile, Dogwalkers moved up to #2 from #11 YoY alongside a 483.5% sales increase, while Comffy sits at #3 after rising from #6 YoY with a 2.1% sales lift, indicating Theraplant’s top rank is secure now but faces faster upward pressure from Dogwalkers than from Comffy.
Notable Products
Pinyatti Pre-Roll (1g) led the movement in August 2026 with a -19.5% month-over-month drop to rank 10, while Banana Breeze Pre-Roll (1g) surged +50.1% to rank 1. Eight of the top ten are Pre-Roll SKUs, concentrating demand at ranks 1 through 6 and 10, and this category skew coincides with Flower sitting at ranks 7 and 8. Banana Breeze Pre-Roll (1g) also posted the month’s highest rank, contrasting with Pinyatti Pre-Roll (1g)’s slide, and Foreverberry Pure Co2 Mini Tank Disposable (0.5g) held rank 9 with the only non-Pre-Roll placement in the top ten besides Flower. The pattern implies Theraplant is prioritizing breadth and volume in Pre-Rolls over parity across categories, signaling a pivot toward high-velocity formats even as premium Flower and a single Vapor Pens SKU anchor secondary positions.
Top Selling Cannabis Brands






Data for this report comes from real-time sales reporting by participating cannabis retailers via their point-of-sale systems, which are linked up with Headset’s business intelligence software. Headset’s data is very reliable, as it comes digitally direct from our partner retailers. However, the potential does exist for misreporting in the instance of duplicates, incorrectly classified products, inaccurate entry of products into point-of-sale systems, or even simple human error at the point of purchase. Thus, there is a slight margin of error to consider. Brands listed on this page are ranked in the top twenty within the market and product category by total retail sales volume.

