Market Insights Snapshot

Back Home Cannabis Co. leaned further into Flower in May 2026, with Flower at 70.29% share and up 4.07% month over month while rising 1.41% year over year; Pre-Roll held 28.27% share and grew 10.56% MoM alongside a 28.42% YoY increase, and Edible, though just 1.44% share, jumped 31.03% MoM and 29.22% YoY. Despite a brand-level average price decline of 11.65% YoY to $38.04, category-level momentum skewed toward value-accessible formats as Pre-Roll growth outpaced Flower both MoM (10.56% vs. 4.07%) and YoY (28.42% vs. 1.41%). The pattern implies mix-driven volume capture anchored in Flower for stability while Pre-Roll and Edible supply incremental gains that are sensitive to pricing and promotional efficiency in New York.
Positioning-wise, the 8 rank in Flower within New York alongside a 70.29% Flower mix points to a core identity tied to inhalables, but the outsized Pre-Roll YoY growth of 28.42% versus Flower’s 1.41% indicates consumer migration within inhalables toward convenience formats. With brand sales up 8.18% YoY and 390.79% over 24 months, and with Pre-Roll’s 10.56% MoM rise outpacing Flower’s 4.07% in May 2026, the brand’s near-term leverage sits in balancing Flower rank defense with margin-aware expansion in Pre-Roll, implying a pricing architecture where the average price reduction coincides with mix shifts that can sustain share without overextending discount depth.
Competitive Landscape
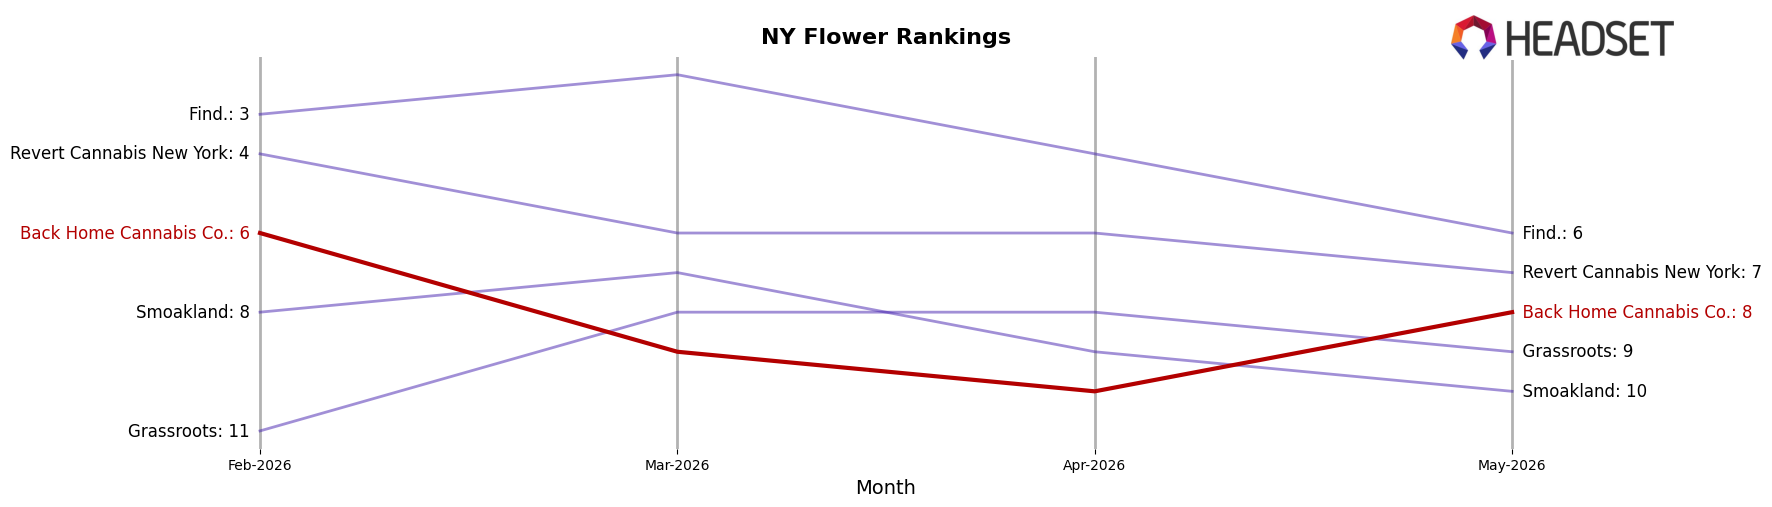
Back Home Cannabis Co. sits at rank 8 in NY Flower for May 2026, a 1-position improvement from rank 9 year over year, but down 2 spots from rank 6 three months ago; the brand’s peak at rank 3 in August 2025 contrasts with today’s placement, signaling a retreat from prior highs while still outperforming last May. Competitive context shifted sharply as Leal moved from rank 11 to rank 1 with a 109.3% YoY sales increase, while Dank. By Definition slid from rank 1 to rank 2 alongside a 38.1% YoY sales decline; meanwhile, RYTHM advanced from rank 10 to rank 4 with a 45.8% YoY gain, indicating that competitors with accelerating momentum are concentrating near the top ranks. The pattern implies Back Home Cannabis Co.’s modest YoY rank lift alongside a 2-position quarter-over-quarter dip points to mid-tier stability but insufficient velocity to reclaim peak share without countering fast-rising rivals.
Notable Products
Northern Lights (3.5g) led May 2026 by holding rank 1 despite a -1.9% month-over-month dip, while White Widow (3.5g) climbed to rank 2 on +11.9% and Super Lemon Haze (3.5g) advanced at +8.4% to rank 4. Six of the top ten are Flower SKUs, and three Pre-Roll six-packs sit at ranks 7–9 with Northern Lights Pre-Roll 6-Pack (3g) up +8.0%, indicating the brand is consolidating demand around classic Flower strains with Pre-Rolls providing secondary lift.
Acapulco Gold (3.5g) in rank 3 edged up +1.3% while its paired Acapulco Gold Pre-Roll 6-Pack (3g) rose +10.1% at rank 8, and GG4 (3.5g) gained +6.3% at rank 6 as Maui Wowie (3.5g) slipped -1.7% at rank 5. With Jack Herer (3.5g) posting +7.0% at rank 10 alongside a first-time listing for Maui Wowie Pre-Roll 6-Pack (3g) at rank 9 and $86,535 in sales, the mix points to a portfolio concentrating on evergreen strain families where Pre-Rolls amplify, but do not displace, core Flower positions.
Top Selling Cannabis Brands
Data for this report comes from real-time sales reporting by participating cannabis retailers via their point-of-sale systems, which are linked up with Headset’s business intelligence software. Headset’s data is very reliable, as it comes digitally direct from our partner retailers. However, the potential does exist for misreporting in the instance of duplicates, incorrectly classified products, inaccurate entry of products into point-of-sale systems, or even simple human error at the point of purchase. Thus, there is a slight margin of error to consider. Brands listed on this page are ranked in the top twenty within the market and product category by total retail sales volume.

