Market Insights Snapshot
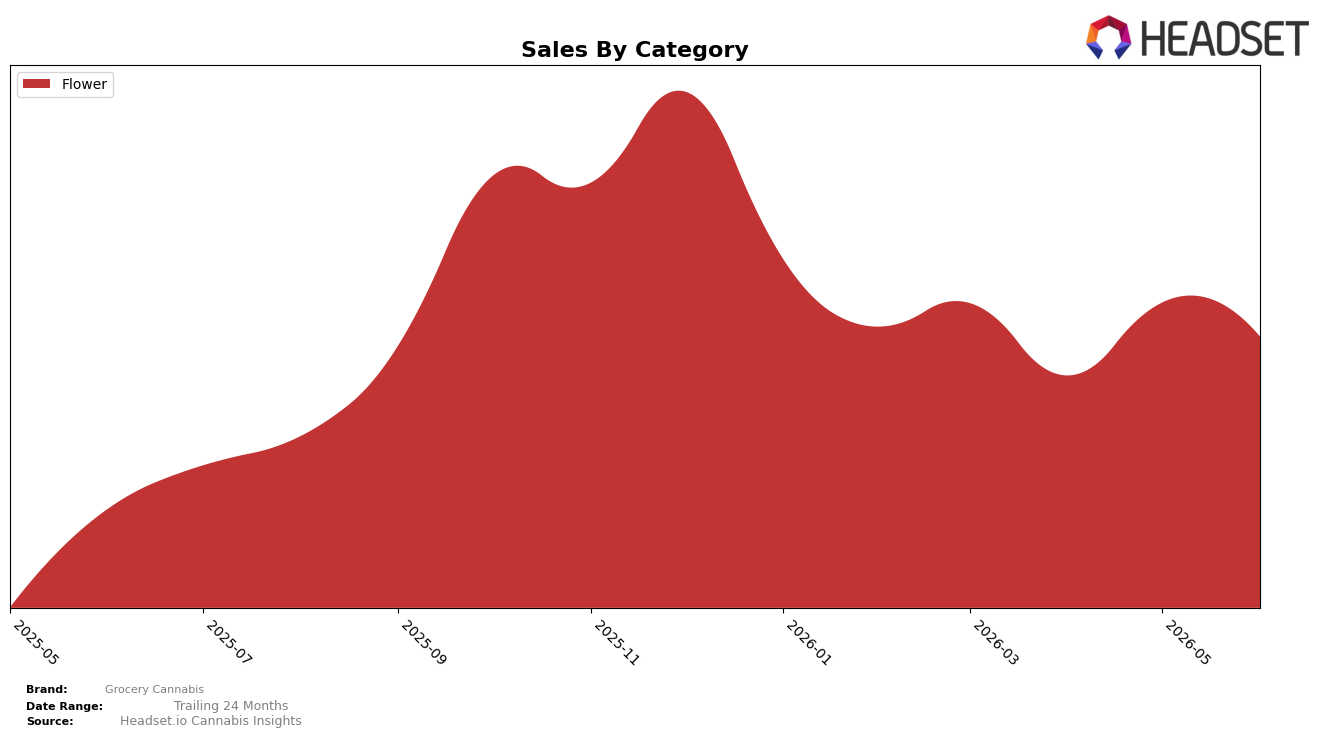
Grocery Cannabis concentrated entirely in Flower at 100.0% mix during June 2026, pairing a 120.0% year-over-year sales increase with a -9.7% month-over-month decline, while average price sat at $149.32 alongside a -3.6% year-over-year price shift. With no other categories present in the mix and a Flower rank of 15 in New York, the combination of triple-digit annual growth and a single-category footprint implies upside tied to depth in Flower but vulnerability to monthly volatility without diversification.
The -9.7% month-over-month slide against triple-digit year-over-year growth suggests demand momentum is still intact but sensitive to short-cycle swings, especially with a -3.6% price change limiting premium headroom while maintaining accessibility. Holding the 15th rank in New York Flower against a 100.0% category concentration implies current positioning is mid-pack and volume-driven; defending or improving that rank likely depends on stabilizing month-over-month cadence within Flower or selectively expanding into an adjacent category to buffer single-category variability.
Competitive Landscape
Grocery Cannabis sits at rank #15 in NY Flower for June 2026, improving 8 positions year over year from #23 but slipping 4 spots since March 2026 from #11, while its peak of #7 in November 2025 underscores a mid-term pullback; in contrast, Find. climbed from #3 to #1 with 35.6% YoY sales growth and RYTHM advanced from #10 to #5 with 40.6% YoY growth, whereas Dank. By Definition fell from #1 to #3 amid a 50.7% YoY sales decline. The combination of an 8-rank YoY gain but a 4-rank quarter-over-quarter slide implies Grocery Cannabis is stabilizing above last year’s floor yet losing near-term share to faster risers at the top, signaling a need to convert episodic peaks into sustained rank retention.

Notable Products
Blue Dream (28g) delivered the headline move in June 2026 with a 116% month-over-month surge that vaulted it to rank 1, while Triple Double OG (28g) fell 54% to rank 6, creating a sharp bifurcation at the top. Championship Kush (28g) also contracted 49% yet held rank 4, whereas Ghost OG #8 (28g) rose 26% to rank 5, signaling a shift in shopper preference toward uplift-forward profiles within large-format Flower. With all top-10 SKUs concentrated in Flower and only two products posting double-digit declines against one triple-digit gainer, the mix points to Grocery Cannabis leaning into high-velocity 28g strains to consolidate share at the pinnacle of the lineup.
Top Selling Cannabis Brands
Data for this report comes from real-time sales reporting by participating cannabis retailers via their point-of-sale systems, which are linked up with Headset’s business intelligence software. Headset’s data is very reliable, as it comes digitally direct from our partner retailers. However, the potential does exist for misreporting in the instance of duplicates, incorrectly classified products, inaccurate entry of products into point-of-sale systems, or even simple human error at the point of purchase. Thus, there is a slight margin of error to consider. Brands listed on this page are ranked in the top twenty within the market and product category by total retail sales volume.

