.svg)

Sep-2026
Sales
Trend
6-Month
Product Count
SKUs
Avg Price
YoY Sales Change
YoY Price Change


Where to Buy
Matter. is stocked at 100 licensed dispensaries across New York, Pennsylvania, and 5 other states, 64 of them in New York, with the deepest coverage in New York, Queens, Staten Island, Brooklyn, and Buffalo. Search by ZIP code or city below to find the closest one, or filter by product type if you are after a specific format.
Market Insights Snapshot
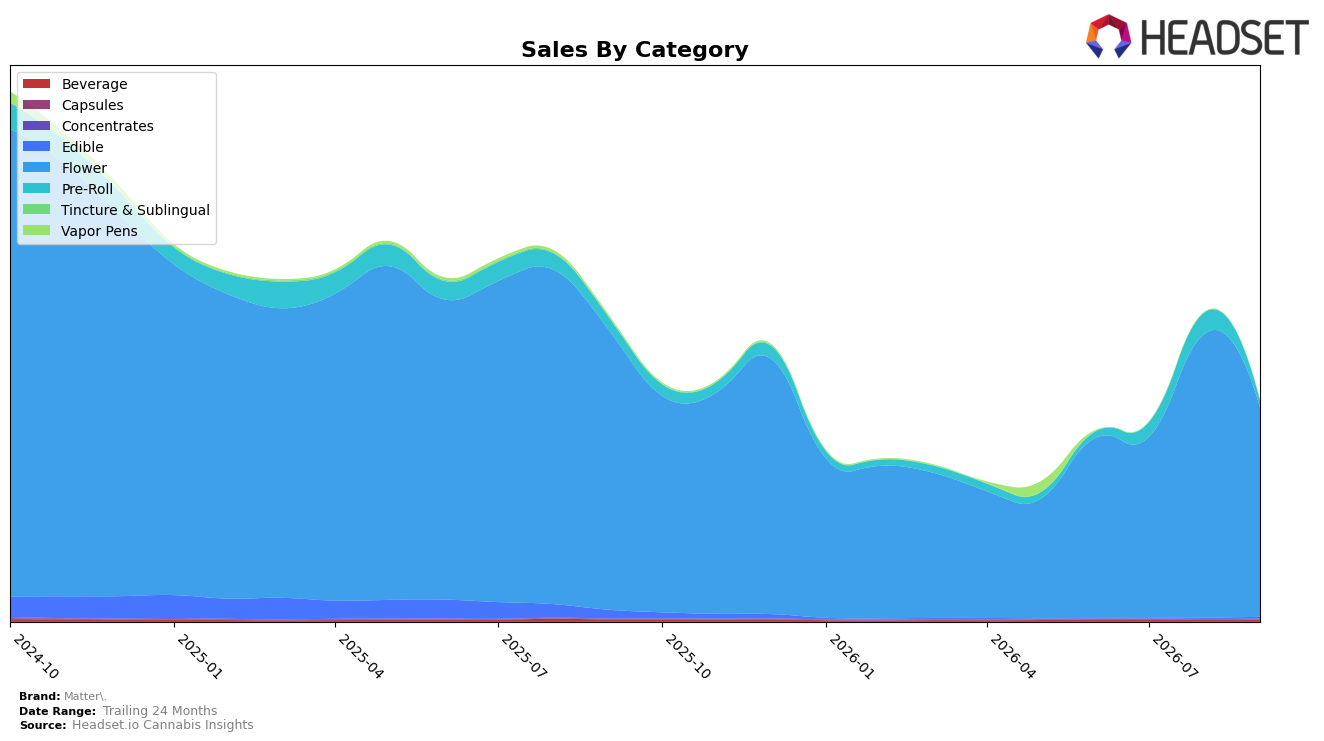
Matter.’s sales in Flower accounted for 95.68% share in September 2026 while ranking 17th in Ohio Flower, with category sales down 25.33% year over year and 26.21% month over month; this concentration contrasts with Pre-Roll at 2.87% share, which fell 48.69% YoY and 69.99% MoM. Smaller lines moved in opposite directions month to month: Beverage rose 23.97% MoM despite an 8.70% YoY decline, and Edible jumped 50.05% MoM after an 83.21% YoY drop, while brand-wide sales declined 28.11% YoY alongside a 21.89% YoY reduction in average price. The pattern implies overexposure to a contracting Flower base that is pressuring overall rank and pricing power even as niche categories show early recovery signals.
With a 95.68% reliance on Flower and a September 2026 state-category rank of 17 in Ohio, Matter. is positioned as a Flower-centric value player after cutting average prices 21.89% YoY, but the simultaneous 26.21% MoM Flower contraction and 69.99% MoM Pre-Roll drop suggest limited cross-category insulation. Beverage’s 23.97% MoM lift and Edible’s 50.05% MoM rebound, together representing only 1.45% combined share, indicate that diversification is too small to offset a 25.33% YoY Flower decline and a 28.11% brand-level YoY slide. The implication is that stabilizing rank and share will require either reclaiming Flower velocity at current price tiers or scaling the faster-moving non-Flower lines enough to materially dilute Flower’s 95%+ mix.
Competitive Landscape
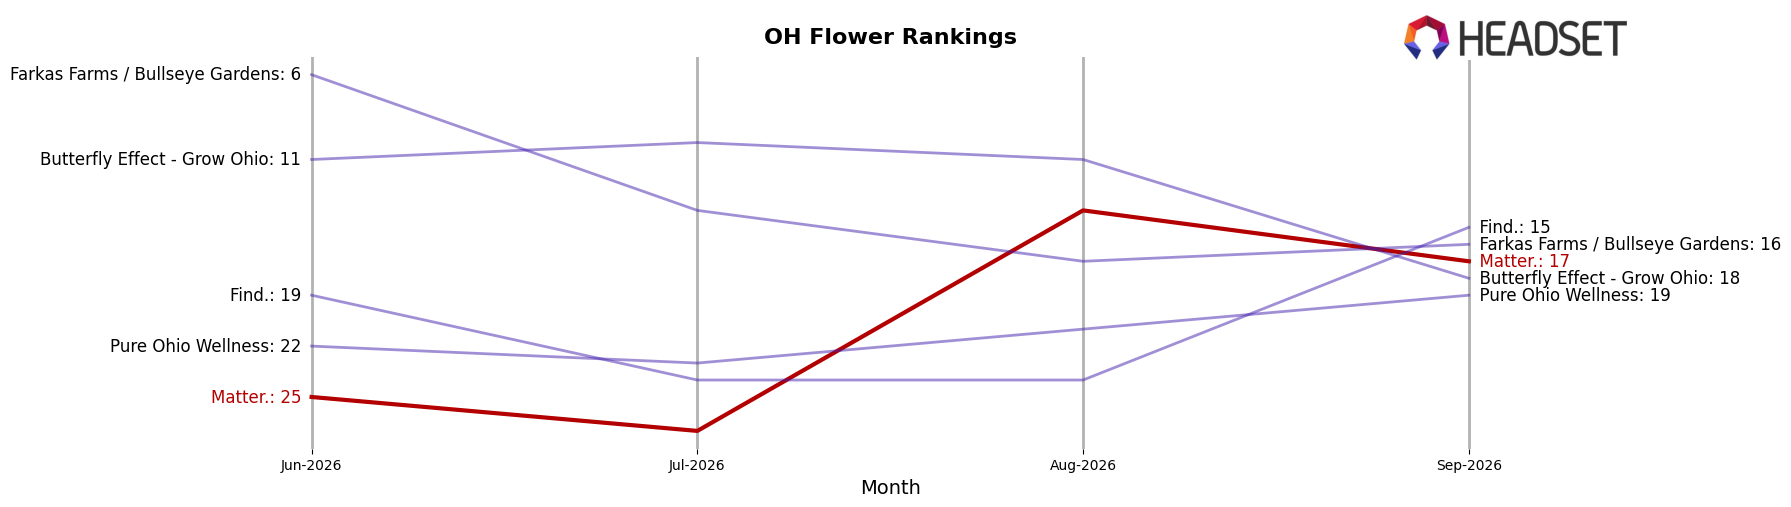
Matter. sits at rank #17 in OH Flower, up 8 positions from #25 in June 2026 and 3 positions from #20 in July 2026, after peaking at #14 in August 2026; meanwhile, Klutch Cannabis advanced to #1 with a 162.4% year-over-year sales increase and a 13-rank climb, and Northwoods Cannabis surged to #5 with a 76-rank jump and a 105,837.8% sales increase, indicating Matter.’s mid-tier ascent is occurring while leaders consolidate higher ranks and widen separation, implying that sustaining momentum from August 2026’s #14 peak will require outpacing double-digit rank moves by top competitors rather than incremental gains.
Notable Products
Sour Juice (14.15g) posted the standout move with +126.99% month over month and jumped to rank 1, while Bananaconda (14.15g) fell -33.43% and slid to rank 7. Melonade (2.83g) also surged +70.13% to rank 3, and four of the top ten are Flower SKUs in 14g–14.15g pack sizes, concentrating volume in large-format Flower. The single-digit placement of Pre-Roll at rank 9 alongside rank 1 and rank 3 Flower signals a product mix tilting toward higher-weight Flower as the commercial priority.
Top Selling Cannabis Brands






Data for this report comes from real-time sales reporting by participating cannabis retailers via their point-of-sale systems, which are linked up with Headset’s business intelligence software. Headset’s data is very reliable, as it comes digitally direct from our partner retailers. However, the potential does exist for misreporting in the instance of duplicates, incorrectly classified products, inaccurate entry of products into point-of-sale systems, or even simple human error at the point of purchase. Thus, there is a slight margin of error to consider. Brands listed on this page are ranked in the top twenty within the market and product category by total retail sales volume.

