.svg)

Sep-2026
Sales
Trend
6-Month
Product Count
SKUs
Avg Price
YoY Sales Change
YoY Price Change


Where to Buy
High Tech is stocked at 14 licensed dispensaries across Oregon, Colorado, and Maine, 11 of them in Oregon, with the deepest coverage in Eugene, Salem, Astoria, Aurora, and Cottage Grove. Search by ZIP code or city below to find the closest one, or filter by product type if you are after a specific format.
Market Insights Snapshot
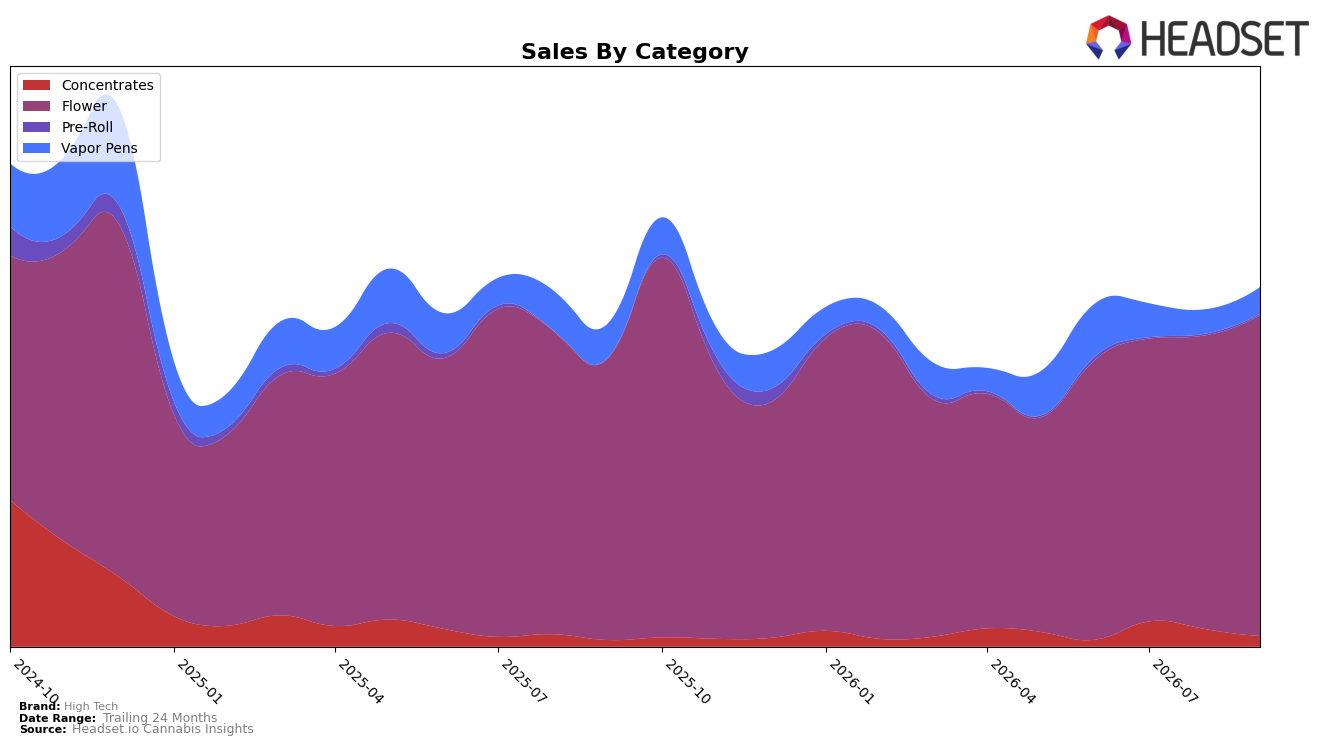
In September 2026, High Tech concentrated 89.37% of sales in Flower, where category sales rose 13.58% year over year and 9.22% month over month, while Vapor Pens held 7.37% share with a 22.66% year-over-year decline but a 9.61% month-over-month lift. Concentrates carried 2.93% share with a 64.29% year-over-year increase but a 40.04% month-over-month drop, and Pre-Roll at 0.33% share fell 10.33% month over month with no year-over-year read. With an average price down 7.06% versus last year alongside a brand-level year-over-year sales gain of 11.12% and a 24‑month decline of 32.51%, the mix points to Flower-led recovery buffered by tactical pricing, implying the brand is regaining volume primarily through its largest category while secondary categories are volatile. High Tech’s Flower position at rank 7 in Oregon anchors the portfolio, but the contrasting 9.22% month-over-month rise in Flower versus the 40.04% month-over-month drop in Concentrates implies a need to stabilize non-core lines to prevent over-reliance on a single category.
The shift toward Flower, combined with a 7.06% year-over-year price decrease and a 13.58% year-over-year lift within the flagship category, signals a value-forward stance that trades price for volume while holding a top-10 rank of 7 in Oregon. The 9.61% month-over-month rebound in Vapor Pens alongside a 22.66% year-over-year contraction suggests tactical promotions can recover near-term velocity but have not reversed longer-term share pressure, while the 64.29% year-over-year expansion in Concentrates contrasted with the 40.04% month-over-month drop indicates episodic wins rather than sustained traction. The implication is that brand positioning skews toward dependable Flower scale with opportunistic forays in smaller categories; to sustain the 11.12% year-over-year brand growth against a 32.51% two-year decline, the portfolio strategy should prioritize consistent availability and pricing discipline in Flower while smoothing volatility in Concentrates and converting Vapor Pens’ month-over-month momentum into durable share.
Competitive Landscape
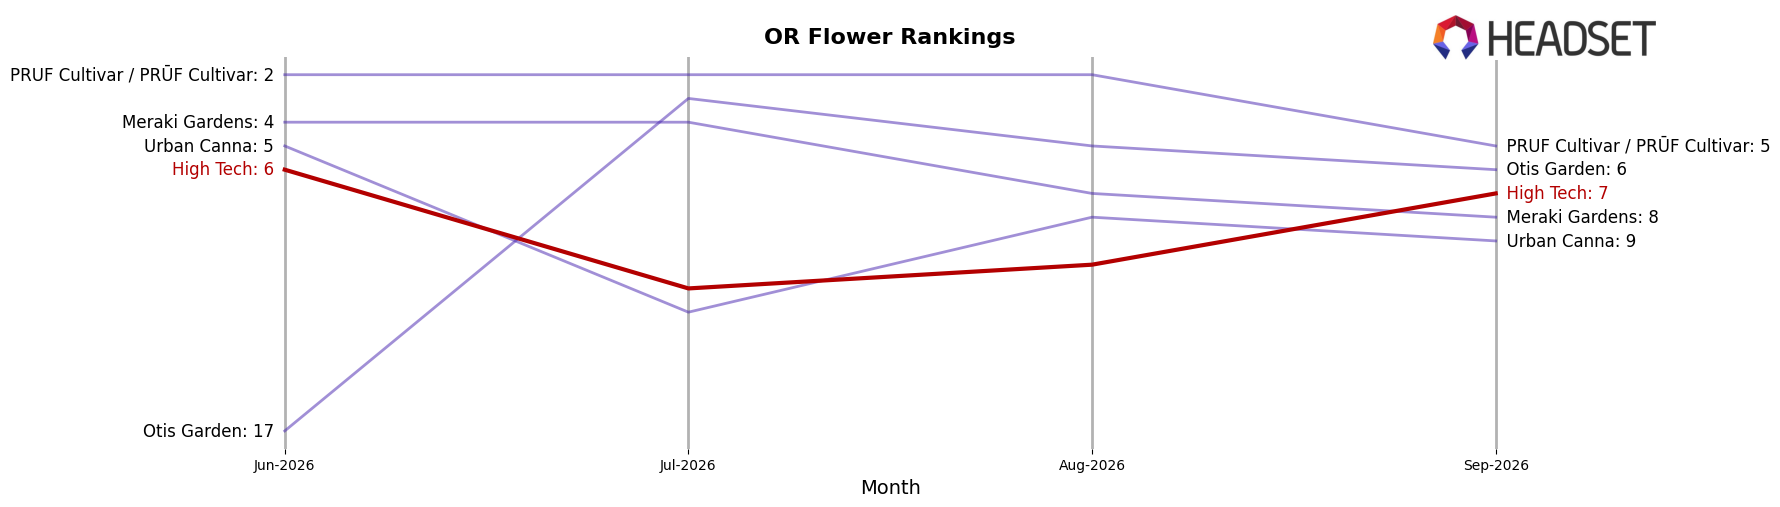
High Tech sits at rank #7 in OR Flower in September 2026, unchanged YoY from #7, after slipping 1 position from #6 three months ago and trailing its peak of #3 set in December 2024; meanwhile, Grown Rogue moved from #3 to #1 with 63.8% YoY sales growth and Oregrown surged from #16 to #3 on 169.7% YoY growth, indicating that High Tech’s flat YoY rank and recent 1-place slide signal share pressure as faster-rising peers consolidate top-tier positions.
Notable Products
Jokerz Candy (Bulk) posted the steepest decline in September 2026 with a -46.1% MoM drop, sliding to rank 7, while Chem Cookies (Bulk) also fell -15.1% MoM at rank 6; in contrast, Gasper (3.5g) edged down -10.1% MoM at rank 8. Dawg Cake (3.5g) led the board at rank 1 and Dawg Cake (14g) held rank 4 with $36,101, and four of the top ten are Flower SKUs in the 3.5g size, concentrating demand in smaller pack formats. The pattern implies High Tech is leaning into 3.5g Flower dominance while bulk variants face elasticity and inventory risk, signaling a pivot toward velocity over weight-based volume.
Top Selling Cannabis Brands






Data for this report comes from real-time sales reporting by participating cannabis retailers via their point-of-sale systems, which are linked up with Headset’s business intelligence software. Headset’s data is very reliable, as it comes digitally direct from our partner retailers. However, the potential does exist for misreporting in the instance of duplicates, incorrectly classified products, inaccurate entry of products into point-of-sale systems, or even simple human error at the point of purchase. Thus, there is a slight margin of error to consider. Brands listed on this page are ranked in the top twenty within the market and product category by total retail sales volume.

