.svg)
Sep-2026
Sales
Trend
6-Month
Product Count
SKUs
Avg Price
YoY Sales Change
YoY Price Change


Where to Buy
Otis Garden is stocked at 92 licensed dispensaries across Oregon, with the deepest coverage in Portland, Ontario, Bend, Eugene, and Salem. Search by ZIP code or city below to find the closest one, or filter by product type if you are after a specific format.
Market Insights Snapshot
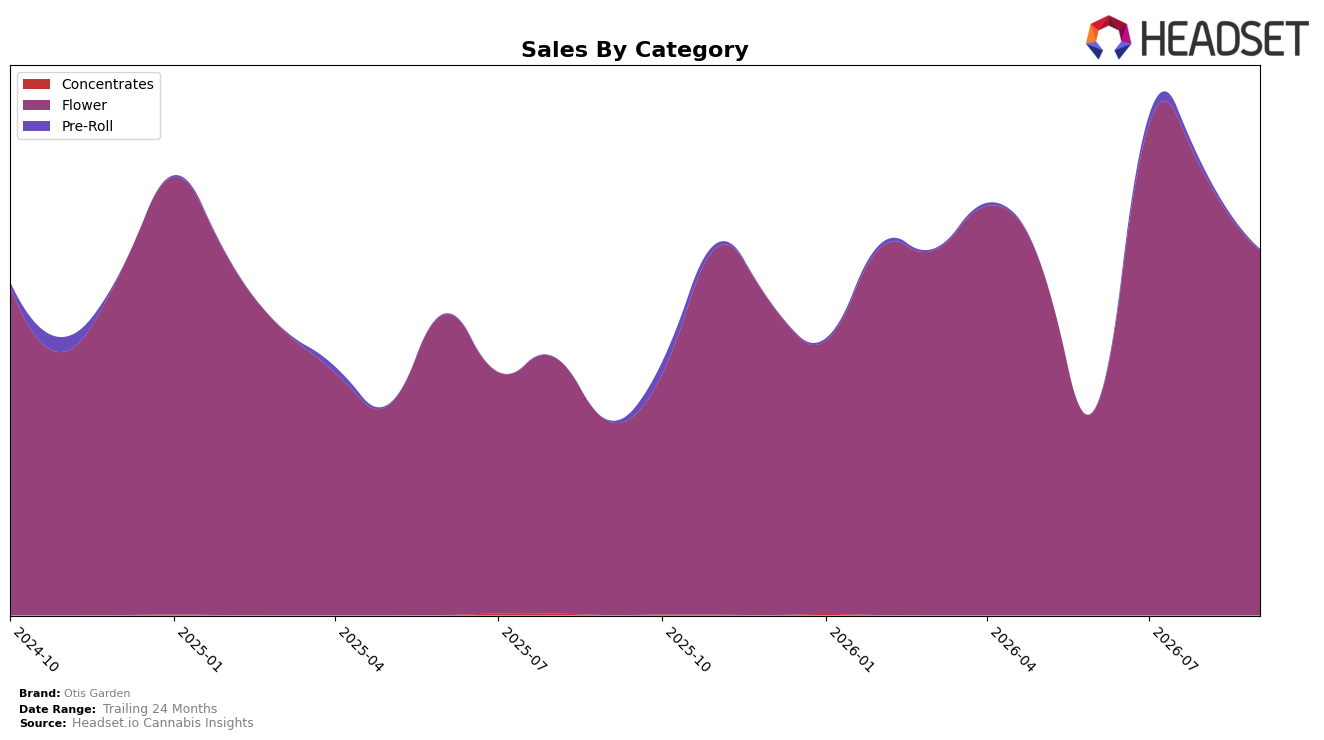
Otis Garden concentrated 99.65% of September 2026 sales in Flower while Pre-Roll held 0.35% share, and the Flower segment ranked 6th in Oregon for the month. Year over year, Flower grew 88.09% while Pre-Roll climbed 109.27%, yet month over month both pulled back with Flower down 17.18% and Pre-Roll down 74.83%. With average price up 42.33% year over year alongside an 88.15% brand sales lift, the pattern implies volume retention despite pricing, but the steep Pre-Roll monthly drop versus a moderate Flower decline suggests SKU rationalization around core Flower to protect the 6th-place position in Oregon.
The mix shift — 99.65% Flower share paired with a 17.18% monthly dip versus a 74.83% monthly contraction in Pre-Roll — implies deliberate focus on high-velocity Flower lines rather than diversifying into small Pre-Roll niches. Given an 88.15% brand sales increase year over year against a 42.33% rise in average price, Otis Garden is leaning into price-led value perception in Flower while deprioritizing Pre-Roll exposure at 0.35% share; this positioning trades breadth for depth to sustain rank 6 in Flower and concentrates marketing and inventory where elasticity appears more forgiving.
Competitive Landscape
Otis Garden ranks #6 in OR Flower in September 2026, improving 12 places year over year from #18 and jumping 11 spots from June 2026’s #17 to reach a peak of #3 in July 2026 before settling back to #6; meanwhile, Grown Rogue advanced from #3 to #1 with 63.8% YoY sales growth and Oregrown climbed from #16 to #3 with 169.7% YoY growth, indicating that Otis Garden’s rapid ascent into the top tier is real but now contending with faster climbers, implying the brand must convert its mid-summer peak into sustained share or risk being boxed out of the top five.

Notable Products
Orange Cream Cake (Bulk) posted the steepest move in September 2026 with a -53.6% month-over-month decline, sliding to rank 4 while Ocean Air (Bulk) also fell -43.1% to rank 10. In contrast, Cap'n Jack (Bulk) grew +16.8% MoM and rose to rank 3, creating a widening performance gap between mid-pack bulk SKUs and lagging bulk offerings. With Flower occupying 10 of the top 10 positions and Blueberry Muffin (Bulk) down -27.9% at rank 6, the mix signals that bulk volatility is pressuring average velocity even as a few bulk winners gain share. The pattern implies Otis Garden is leaning on a Flower-heavy lineup where selective bulk bets can scale, but portfolio pruning is needed to reduce drag from underperforming bulk SKUs.
Top Selling Cannabis Brands






Data for this report comes from real-time sales reporting by participating cannabis retailers via their point-of-sale systems, which are linked up with Headset’s business intelligence software. Headset’s data is very reliable, as it comes digitally direct from our partner retailers. However, the potential does exist for misreporting in the instance of duplicates, incorrectly classified products, inaccurate entry of products into point-of-sale systems, or even simple human error at the point of purchase. Thus, there is a slight margin of error to consider. Brands listed on this page are ranked in the top twenty within the market and product category by total retail sales volume.

