.svg)

Aug-2026
Sales
Trend
6-Month
Product Count
SKUs
Avg Price
YoY Sales Change
YoY Price Change


Market Insights Snapshot
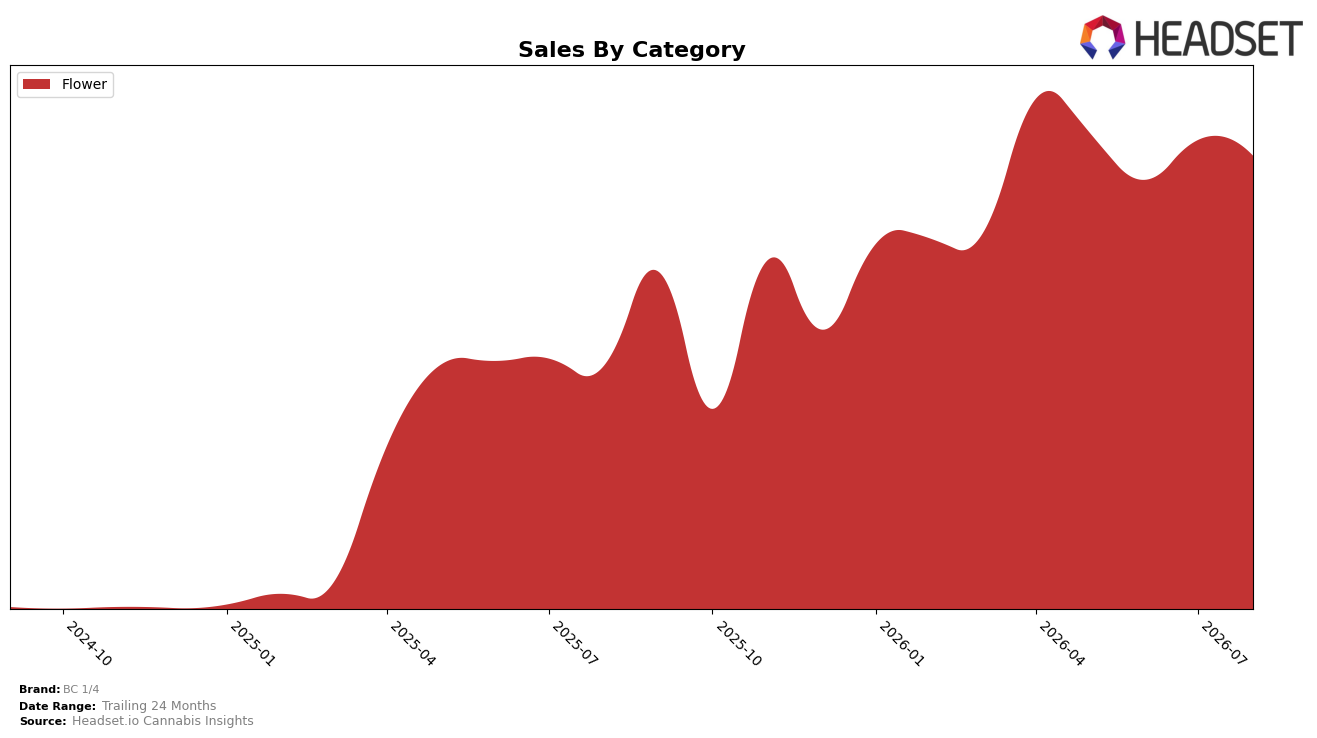
In August 2026, BC 1/4 operated as a single-category brand with Flower at 100.0% of sales share, posting year-over-year sales growth of 86.36% alongside a month-over-month decline of 3.35%. Average price rose 3.41% year over year to $41.86 while the Flower category’s share remained at 100.0%, indicating mix stability even as short-term momentum softened. With Flower ranked 23 in British Columbia, the combination of high YoY expansion and slight MoM contraction implies a scale-up phase tempered by near-term demand or inventory adjustments.
The unchanged 100.0% concentration in Flower, paired with an 86.36% YoY lift but a 3.35% MoM dip, suggests BC 1/4 is leaning into depth over breadth rather than diversifying into adjacent categories. The 3.41% YoY price increase, concurrent with a rank of 23 in British Columbia, implies pricing power is being tested within a crowded mid-tier rank band, and the MoM softness hints that incremental share gains may require tighter promo cadence or pack-size mix tweaks rather than further price moves.
Competitive Landscape
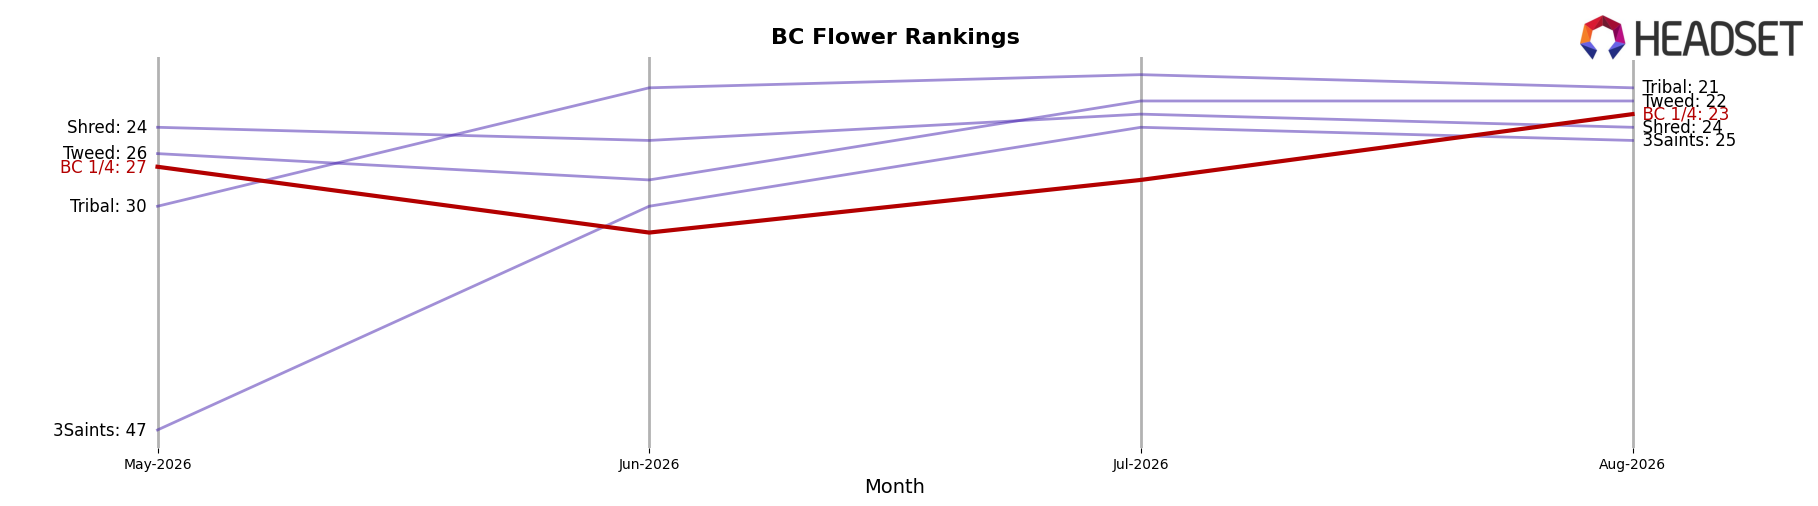
BC 1/4 sits at rank #23 in BC Flower in August 2026, improving 6 positions from #29 year over year, while slipping 4 spots from #27 over the last three months; its peak at #21 in April 2026 places the current #23 just 2 ranks below that high. In contrast, Big Bag O' Buds held at #1 year over year with sales up 33.8%, and Spinach climbed from #4 to #2 with a 54.2% lift, indicating that category leaders are widening the gap even as BC 1/4 gains 6 ranks YoY; the combination of a modest retreat from #27 to #23 in the recent quarter and proximity to the April 2026 peak implies a stabilization phase where incremental share wins are possible if momentum is sustained against faster-moving leaders.
Notable Products
Electric Silk (7g) posted the steepest movement in August 2026 with a -58.7% month-over-month decline while holding rank 3, contrasting with Blue Soufle (7g) which climbed +87.4% MoM to rank 2. Seven of the remaining top-10 Flower SKUs fell more than -20% MoM, including Bone Smashing (7g) at -61.8% and Whiplash (7g) at -47.8%, indicating the surge was concentrated rather than broad-based. With Hindu Kush (7g) steady at rank 1 and all ten top products in Flower, the mix suggests BC 1/4 is leaning into a narrow set of 7g winners rather than expanding category breadth, which implies near-term reliance on a few high-velocity SKUs over diversified momentum.
Top Selling Cannabis Brands






Data for this report comes from real-time sales reporting by participating cannabis retailers via their point-of-sale systems, which are linked up with Headset’s business intelligence software. Headset’s data is very reliable, as it comes digitally direct from our partner retailers. However, the potential does exist for misreporting in the instance of duplicates, incorrectly classified products, inaccurate entry of products into point-of-sale systems, or even simple human error at the point of purchase. Thus, there is a slight margin of error to consider. Brands listed on this page are ranked in the top twenty within the market and product category by total retail sales volume.

