Jun-2026
Sales
Trend
6-Month
Product Count
SKUs
Avg Price
YoY Sales Change
YoY Price Change
Market Insights Snapshot
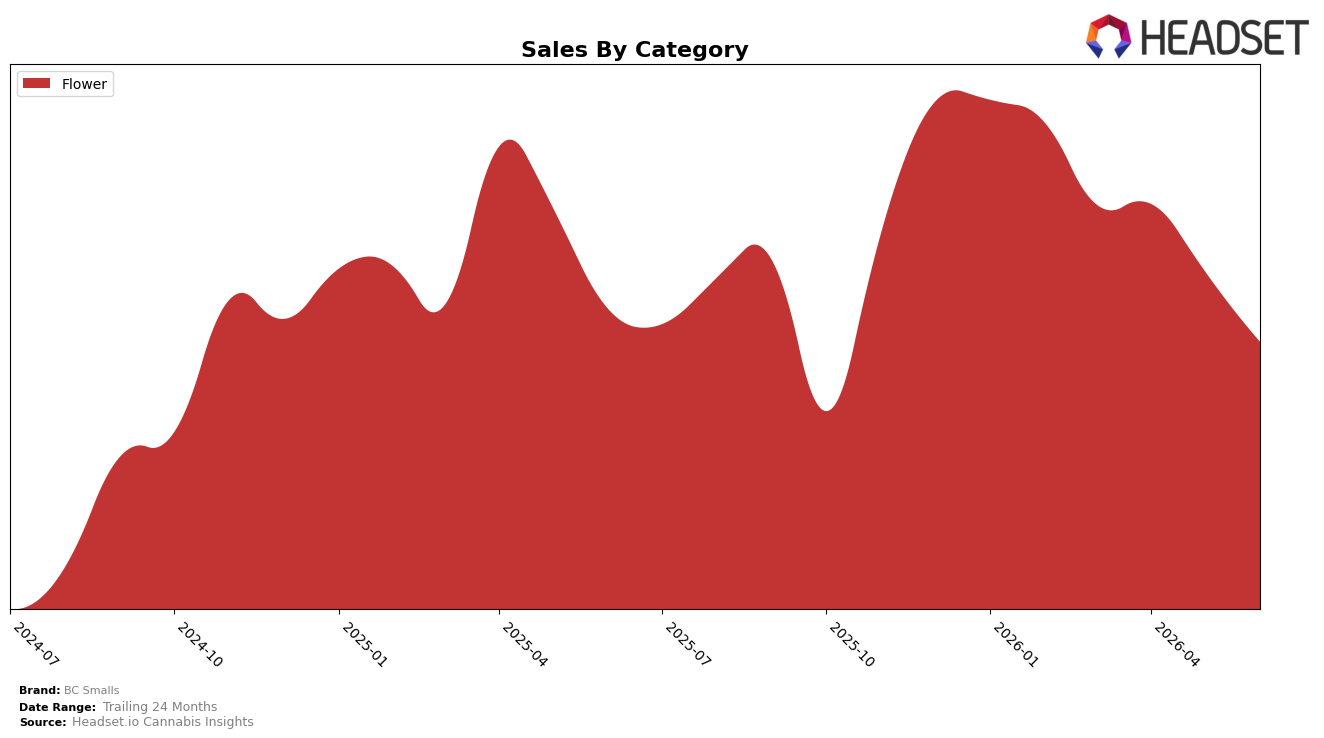
In June 2026, BC Smalls operated as a single-category brand with Flower at 100.0% of sales, while Flower sales declined 6.62% year over year and 13.33% month over month; the brand’s average item price was essentially flat with a 0.24% YoY uptick and implied negative MoM unit momentum given a double-digit sales drop. Within British Columbia Flower, BC Smalls held rank 7, a placement that, combined with a 100.0% category reliance and a 13.33% MoM contraction, suggests concentration risk if June’s volatility persists.
The combination of a 100.0% Flower mix and rank 7 in British Columbia, alongside a 6.62% YoY and 13.33% MoM sales decline, implies the brand is tied to category headwinds and is trading share for limited pricing stability (+0.24% YoY). With no contribution from other categories and June’s double-digit MoM pullback, the posture implies a need to either climb two to three rank positions within Flower or diversify away from a 100.0% exposure to reduce volatility amplification in months like June 2026.
Competitive Landscape
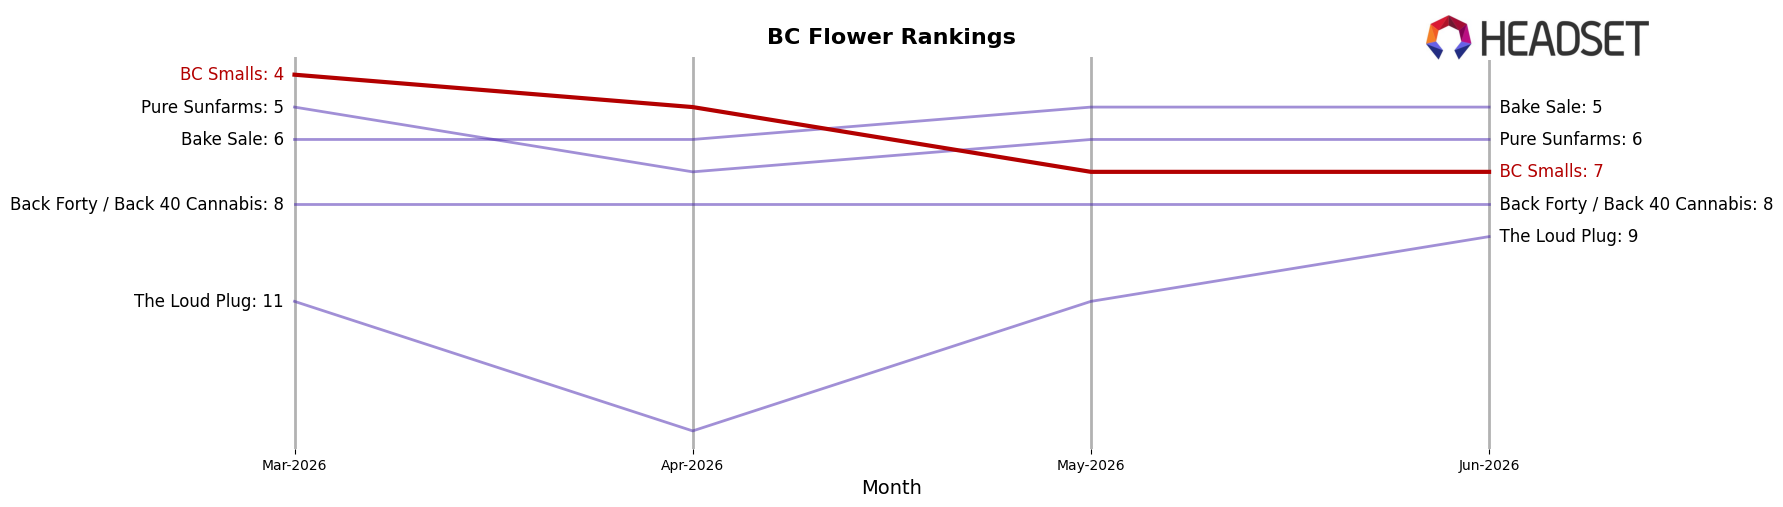
BC Smalls is ranked #7 in BC Flower in June 2026, down 2 positions year over year from #5 and slipping 3 spots since March 2026 from #4 to #7, a reversal from its peak of #2 in April 2025. In contrast, Good Supply moved from #6 to #1 with 78% year-over-year sales growth, and Spinach advanced from #8 to #3 on 85% year-over-year growth, while Bake Sale fell from #3 to #5 with an 8% sales decline. The pattern implies BC Smalls is losing relative velocity as faster-rising leaders compress share at the top, and without a pivot toward mix or price architecture aligned to the growth vectors, mid-tier drift is likely to persist.
Notable Products
Hippie Cripwalk Smalls (3.5g) posted the steepest move in June 2026 with a -10.7% month-over-month change while holding rank 2, outpacing the milder -2.1% dip of rank-1 White Widow Smalls (3.5g) and contrasting with the +5.4% lift for rank-7 Tutti Frutti Crunchy Puff Smalls (3.5g). Optimus Crime Smalls (3.5g) at rank 5 fell -37.1% month over month even as Deja Vu Smalls (3.5g) at rank 8 slid -18.6%, signaling that downside is concentrated mid-pack rather than at the very top.
All ten top SKUs are Flower, with seven posting negative or missing month-over-month signals versus only one clear gainer at +5.4%, and ranks 1–3 are tightly clustered despite divergent MoM trends. With two of the top three in decline and only one named SKU showing positive momentum, the June 2026 mix implies BC Smalls is leaning on a leader-heavy Flower portfolio that needs fresh upside catalysts below the top ranks to stabilize share and pricing power.
Top Selling Cannabis Brands
Data for this report comes from real-time sales reporting by participating cannabis retailers via their point-of-sale systems, which are linked up with Headset’s business intelligence software. Headset’s data is very reliable, as it comes digitally direct from our partner retailers. However, the potential does exist for misreporting in the instance of duplicates, incorrectly classified products, inaccurate entry of products into point-of-sale systems, or even simple human error at the point of purchase. Thus, there is a slight margin of error to consider. Brands listed on this page are ranked in the top twenty within the market and product category by total retail sales volume.

