.svg)

Aug-2026
Sales
Trend
6-Month
Product Count
SKUs
Avg Price
YoY Sales Change
YoY Price Change


Where to Buy
Berkshire Roots is stocked at 66 licensed dispensaries across Massachusetts, with the deepest coverage in Boston, Quincy, Taunton, Brockton, and Fall River. Search by ZIP code or city below to find the closest one, or filter by product type if you are after a specific format.
Market Insights Snapshot
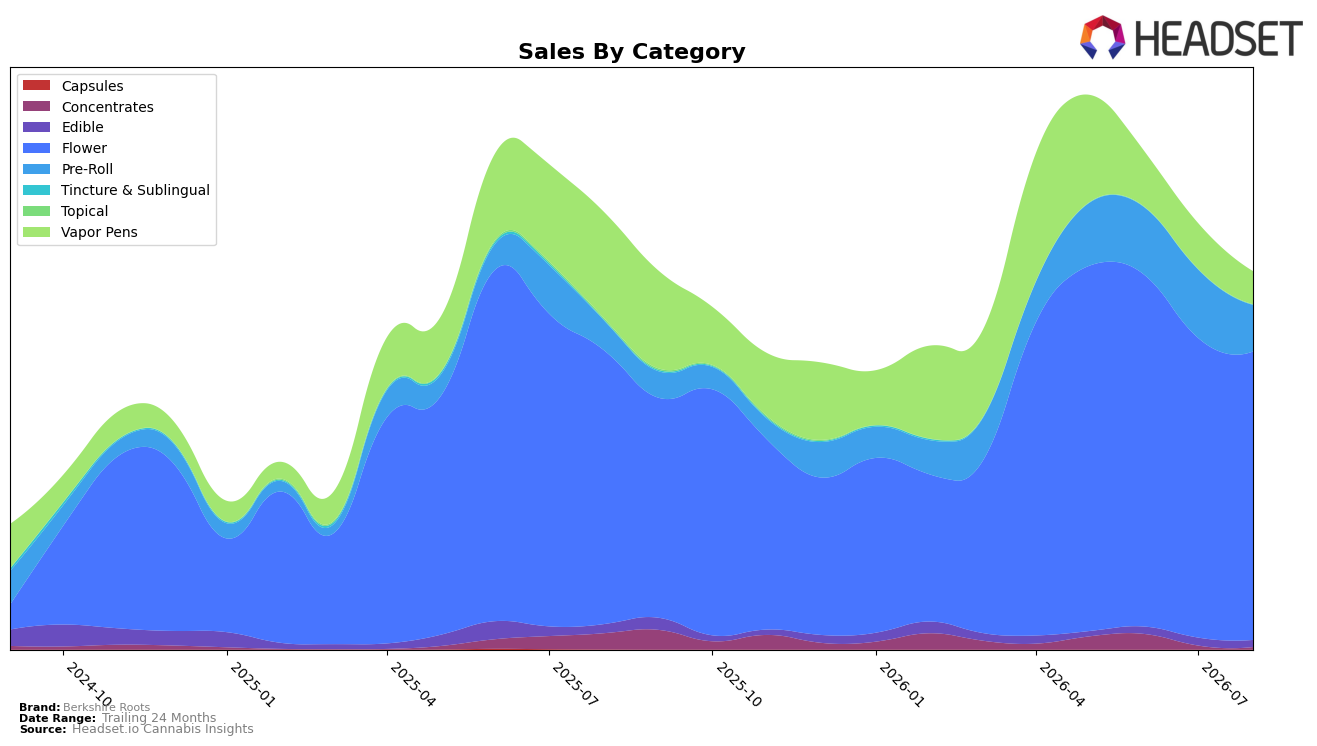
In August 2026, Berkshire Roots leaned heavily into Flower at 76.61% share, while Pre-Roll accounted for 12.29% and Vapor Pens 8.68%, indicating a concentrated mix around inhalables; Flower posted 5.36% YoY growth but slipped 3.79% MoM, whereas Pre-Roll surged 56.47% YoY but fell 32.12% MoM. Vapor Pens contracted 69.14% YoY and 27.98% MoM, and Edible declined 22.66% YoY and 11.06% MoM, reinforcing a pivot away from non-Flower formats even as the overall brand was down 13.61% YoY; with average price up 23.51% YoY to $25.38, the pattern implies reliance on higher-priced Flower to offset volatile Pre-Roll momentum and a retreat in Vapor Pens.
Given a Flower-heavy mix alongside a Flower category rank of 50 in Massachusetts, the 5.36% YoY gain but 3.79% MoM dip signals exposure to short-cycle supply dynamics, while Pre-Roll’s 56.47% YoY lift paired with a 32.12% MoM drop suggests episodic activation rather than durable baseline demand. The 69.14% YoY decline in Vapor Pens and 22.66% YoY decline in Edible concentrate wallet share into inhalables but heightens category risk concentration, and the 23.51% YoY price increase alongside a 27.98% MoM fall in Vapor Pens volume proxies implies price-led mix is cushioning revenue shortfalls rather than expanding reach; this positioning concentrates the brand in Flower defensively instead of building breadth that could stabilize MoM volatility.
Competitive Landscape
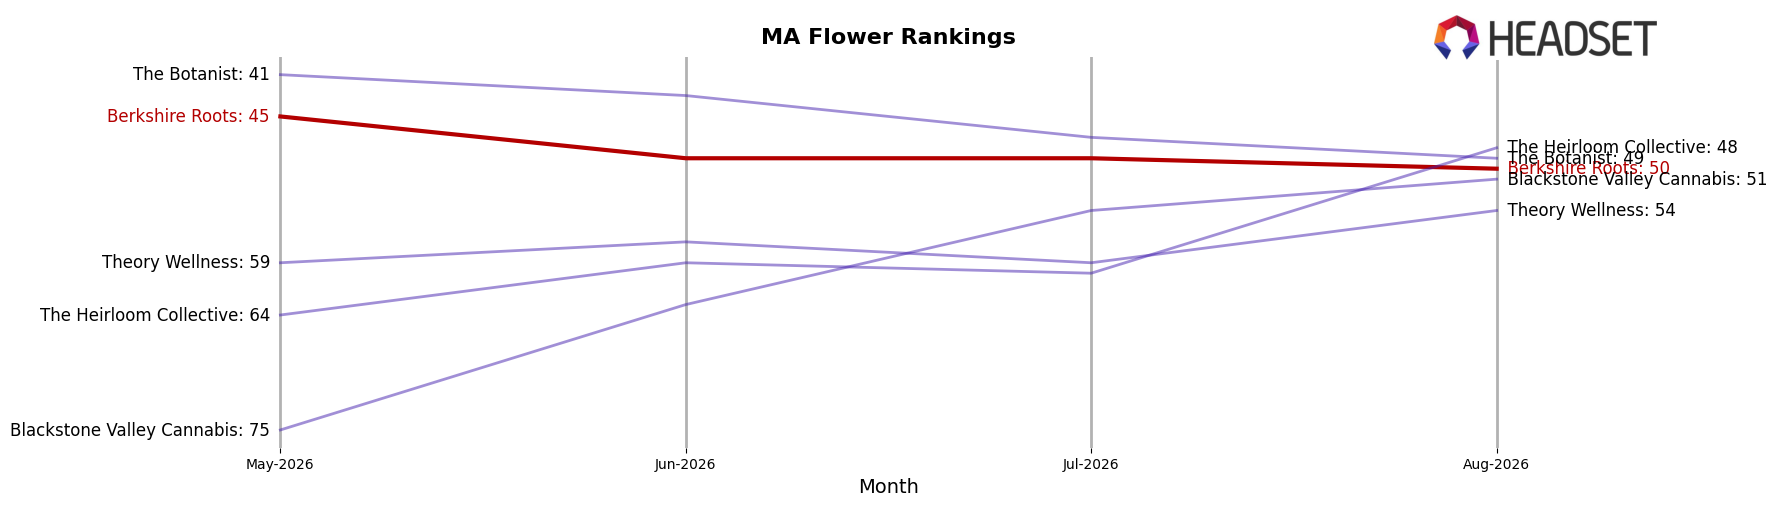
Berkshire Roots sits at rank #50 in MA Flower for August 2026, improving 9 positions from #59 year over year, yet slipping 5 spots from its May 2026 peak at #45 to #50 in August 2026; meanwhile, Perpetual Harvest climbed from #4 to #1 with 51.76% YoY sales growth, and Root & Bloom advanced from #9 to #5 with 50.53% YoY growth, indicating Berkshire Roots’ relative share is not keeping pace with leaders despite a YoY rank gain. The combination of a 9-rank YoY improvement alongside a 5-rank slide from the May 2026 peak implies momentum peaked in late spring and has since been pressured by faster-rising competitors, pointing to a trajectory that risks mid-tier stagnation without a catalyst.
Notable Products
Tropicanna Banana Pre-Roll (1g) posted the standout move with a +225.6% month-over-month surge to rank 2 in August 2026, while Congolese Kush Pre-Roll (1g) fell -50.9% to rank 8, indicating volatility within the Pre-Roll set. Ice Cream Kush (3.5g) climbed +66.2% to rank 3 as Marsh Mellow (3.5g) contracted -45.0% at rank 5, and Orange Chameleon (3.5g) slid a modest -2.4% at rank 4, pointing to sharper swings within mid-tier Flower over top-tier stalwarts. With Pre-Rolls occupying ranks 1 and 2 alongside four Flower SKUs in the top ten, the mix tilts toward a two-pillar strategy where fast-cycling Pre-Rolls capture spikes while Flower anchors share, implying Berkshire Roots is leaning into packable, quick-turn formats to drive incremental volume.
Top Selling Cannabis Brands






Data for this report comes from real-time sales reporting by participating cannabis retailers via their point-of-sale systems, which are linked up with Headset’s business intelligence software. Headset’s data is very reliable, as it comes digitally direct from our partner retailers. However, the potential does exist for misreporting in the instance of duplicates, incorrectly classified products, inaccurate entry of products into point-of-sale systems, or even simple human error at the point of purchase. Thus, there is a slight margin of error to consider. Brands listed on this page are ranked in the top twenty within the market and product category by total retail sales volume.

