.svg)

Sep-2026
Sales
Trend
6-Month
Product Count
SKUs
Avg Price
YoY Sales Change
YoY Price Change


Where to Buy
Khalifa Kush is stocked at 617 licensed dispensaries across Massachusetts, Illinois, and 11 other states, 115 of them in Massachusetts, with the deepest coverage in Boston, Worcester, Fall River, Cambridge, and Springfield. Search by ZIP code or city below to find the closest one, or filter by product type if you are after a specific format.
Market Insights Snapshot
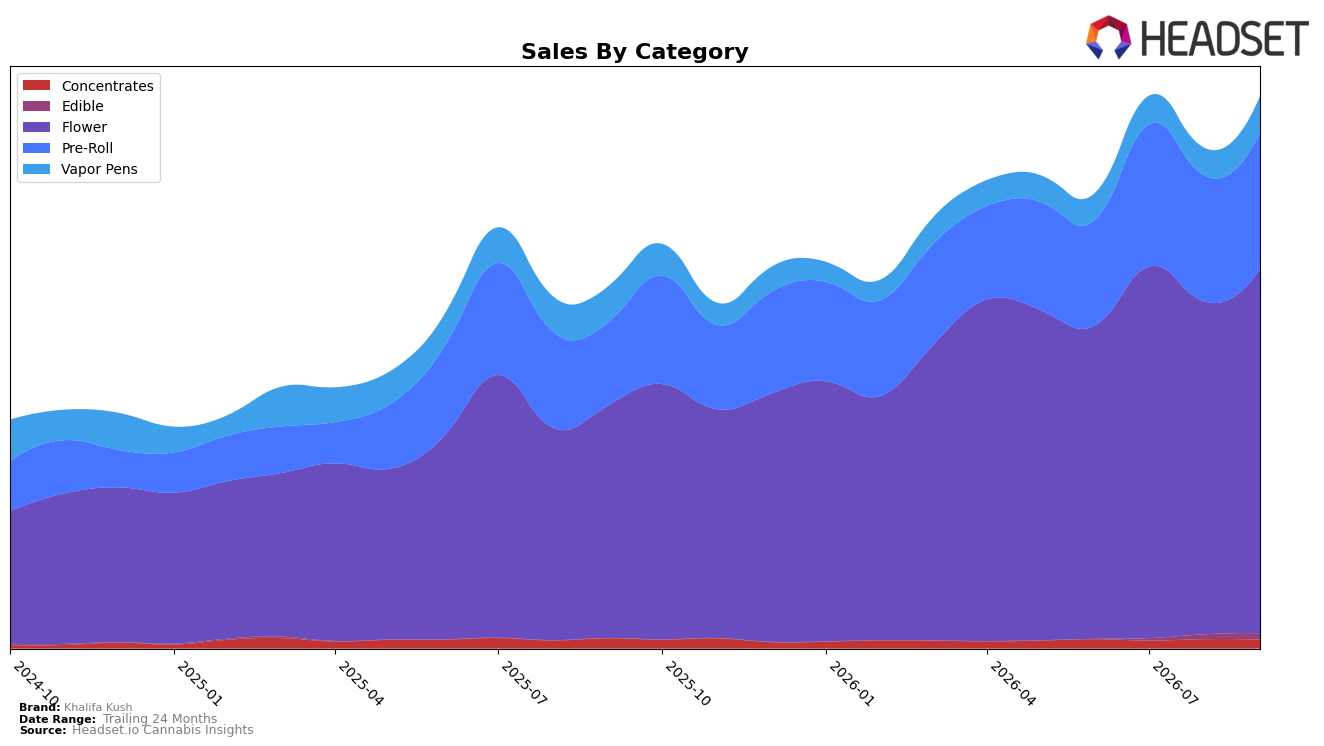
Khalifa Kush concentrated two-thirds of sales in Flower at 66.11% share while Pre-Roll held 24.67%, and Vapor Pens, Concentrates, and Edible combined for 9.22% in September 2026. Year over year, Flower expanded 56.80% and Pre-Roll rose 64.54%, while Vapor Pens barely moved at 0.54% YoY; month over month, Vapor Pens jumped 32.27% and Edible surged 36.85% as Flower and Pre-Roll grew 9.55% and 8.17% respectively. Average price decreased 5.66% YoY to $24.38, and within the mix the highest average price sat in Flower at $41.28 versus Pre-Roll at $11.27, indicating trade-up in core formats alongside accessible entry points. In Nevada Flower, the brand sat at rank 10, implying headroom to climb if Vapor Pens’ 32.27% MoM momentum and Edible’s 36.85% MoM spike can broaden the basket without diluting the 66.11% Flower base.
The pattern implies Khalifa Kush is widening its demand funnel from a Flower-led core (56.80% YoY growth and rank 10 in Nevada Flower) into trial-friendly formats where momentum is outsized, as seen in Vapor Pens’ 32.27% MoM lift and Edible’s 36.85% MoM lift, even while Concentrates receded −14.18% YoY and −6.41% MoM. The 24.67% share in Pre-Roll growing 64.54% YoY alongside a 5.66% YoY brand-wide price decline suggests mix-led volume capture rather than pure discount-driven spikes, positioning the brand to convert Pre-Roll and Vapor Pens trial into Flower loyalty while avoiding overexposure to the shrinking 1.55% Concentrates slice.
Competitive Landscape
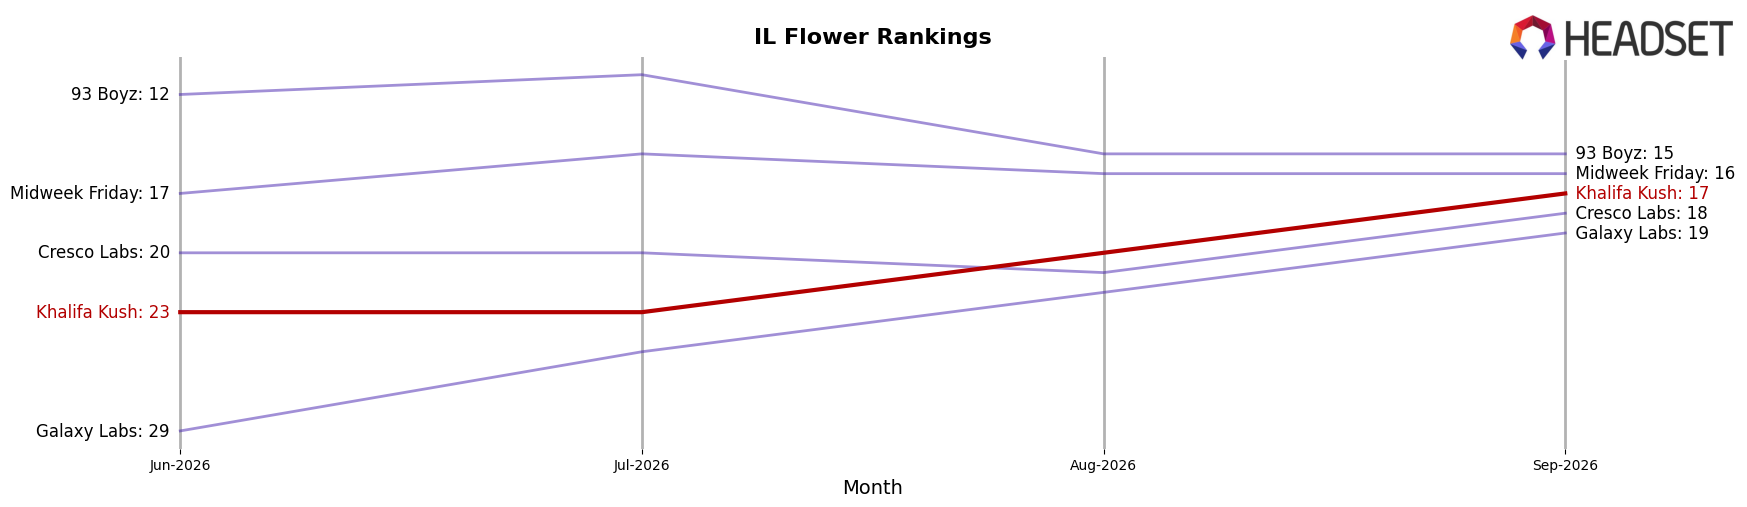
Khalifa Kush sits at rank #17 in Illinois Flower in September 2026, improving 17 positions from #34 year over year, and climbing 6 spots from #23 in June 2026; this is also its peak rank at #17 in September 2026, indicating upward momentum against a stable top tier. Against peers, High Supply / Supply held #1 both year over year and currently while its sales declined 2.5% YoY, whereas RYTHM maintained #2 with a 22.0% YoY sales increase and The Botanist surged from #27 to #4 with a 495.0% YoY sales gain, suggesting Khalifa Kush’s rank ascent is occurring amid mixed competitor velocity where leapfrogging requires sustained share capture rather than relying on top-line softness at incumbents.
Notable Products
Khalifa Kush Infused Pre-Roll (1g) posted the steepest decline in September 2026 at -26.9% and sat at rank 10, while Khalifa Mints Pre-Roll (1g) also contracted -15.3% at rank 7. In contrast, Premium Khalifa Kush Pre-Roll (1g) rose 13.1% to hold rank 1 and Violet Sky Pre-Roll (1g) gained 18.2% at rank 4, indicating a split within Pre-Rolls between classic singles and infused or mint variants. With four of the top six SKUs in September 2026 being Pre-Rolls and three Flower SKUs clustered in ranks 2, 5, and 8, the assortment is tilting toward accessible single-gram formats even as core eighths maintain high placement. This pattern implies Khalifa Kush is concentrating on breadth within standard Pre-Rolls to drive rank stability while de-emphasizing infused extensions that are slipping down the chart.
Top Selling Cannabis Brands






Data for this report comes from real-time sales reporting by participating cannabis retailers via their point-of-sale systems, which are linked up with Headset’s business intelligence software. Headset’s data is very reliable, as it comes digitally direct from our partner retailers. However, the potential does exist for misreporting in the instance of duplicates, incorrectly classified products, inaccurate entry of products into point-of-sale systems, or even simple human error at the point of purchase. Thus, there is a slight margin of error to consider. Brands listed on this page are ranked in the top twenty within the market and product category by total retail sales volume.

