.svg)

Sep-2026
Sales
Trend
6-Month
Product Count
SKUs
Avg Price
YoY Sales Change
YoY Price Change


Where to Buy
Cookies is stocked at 941 licensed dispensaries across New Jersey, Washington, and 27 other states, 131 of them in New Jersey, with the deepest coverage in Jersey City, Atlantic City, Newark, Camden, and Elizabeth. Search by ZIP code or city below to find the closest one, or filter by product type if you are after a specific format.
Market Insights Snapshot
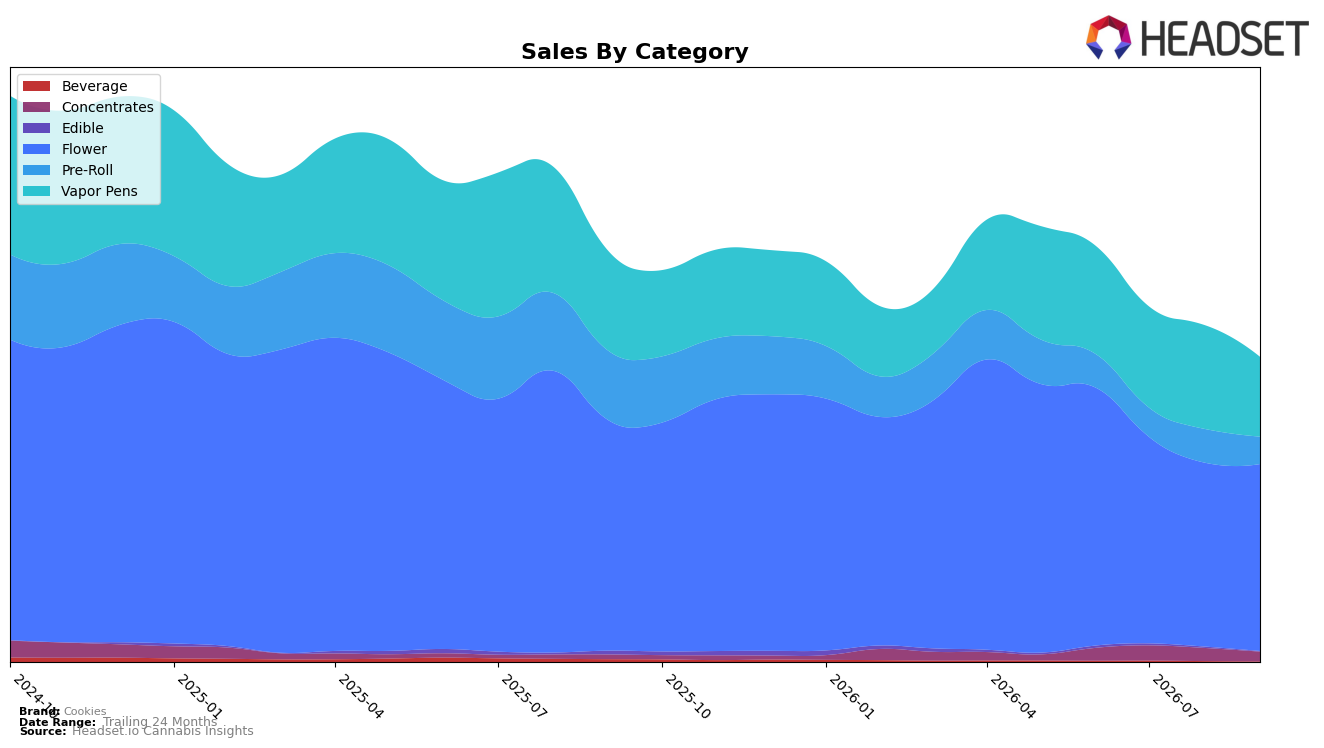
In September 2026, Cookies concentrated 61.15% of sales in Flower with a month-over-month uptick of 1.64% but a year-over-year decline of 18.93%, while Vapor Pens held 26.14% share with a 23.10% month-over-month drop and a 20.05% year-over-year decline. Pre-Roll slipped to 9.01% share with an 18.56% month-over-month decrease and a 60.36% year-over-year contraction, contrasted by Concentrates at 3.25% share showing a 24.99% month-over-month decline but a 106.69% year-over-year gain. Edible and Beverage together accounted for 0.45% share, with Edible down 51.92% month-over-month and 81.68% year-over-year, and Beverage down 33.48% month-over-month and 77.36% year-over-year. Taken together with a brand-level average price down 19.24% year-over-year and overall sales down 25.73% year-over-year, the mix indicates reliance on Flower stability and erosion in value-oriented, multi-pack formats, implying margin pressure from price resets even as core inhalables sustain scale.
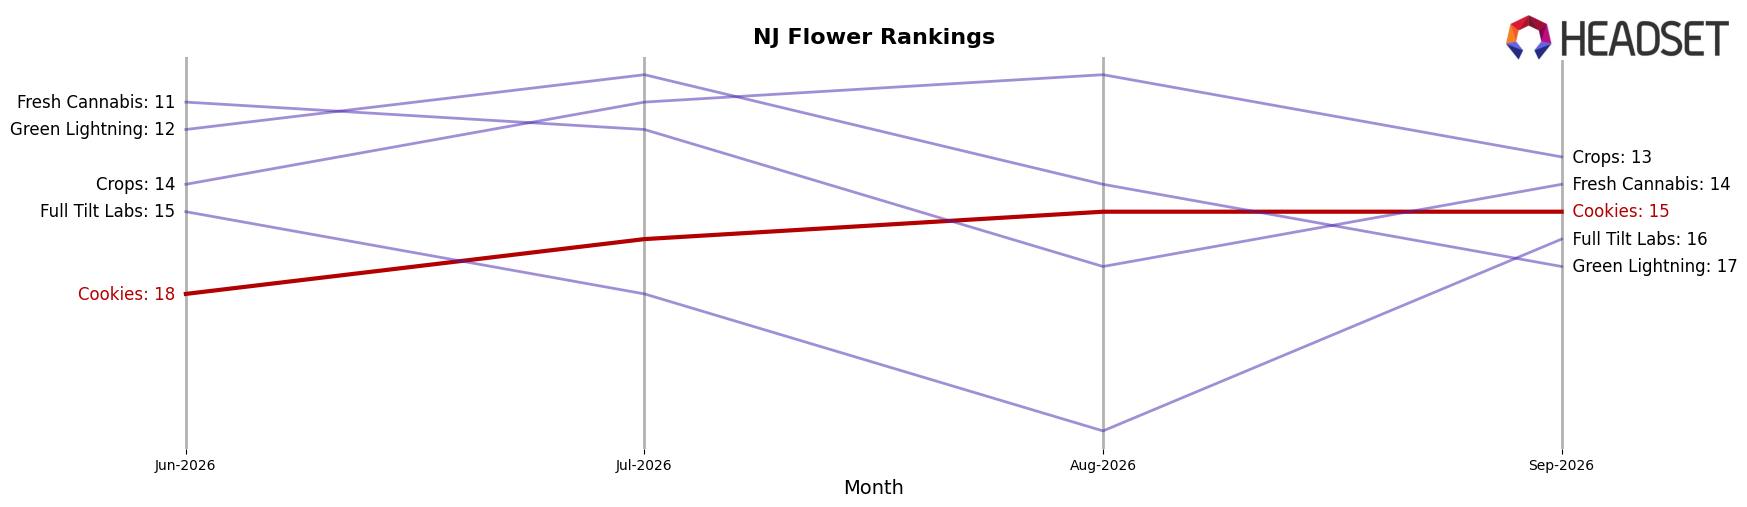
Positioning-wise, the modest month-over-month lift in Flower alongside a steep 23.10% month-over-month pullback in Vapor Pens shifts Cookies further toward combustion-led demand, while the 106.69% year-over-year growth in Concentrates from a 3.25% share base signals a niche that can offset volatility if expanded methodically. With Pre-Roll contracting 60.36% year-over-year and Edible down 81.68% year-over-year, the assortment now under-indexes in convenience and entry-price occasions, and the 15th rank in Flower in New Jersey sets a mid-pack anchor that depends on maintaining the 1.64% month-over-month Flower momentum. The pattern implies Cookies can defend share by deepening SKUs where combustion converts (Flower and selective Concentrates) while pruning or re-pricing underperforming convenience segments to reduce drag from categories posting double-digit month-over-month declines.
Competitive Landscape
Cookies sits at rank #15 in September 2026, improving 5 positions from #20 year over year, while slipping 2 spots from #13 at its April 2026 peak; over the last three months it moved from #18 to #15, a 3-position gain. In contrast, Find. climbed from #6 to #1 year over year alongside 111.6% sales growth, and Good Green jumped from #17 to #3 with 166.7% growth, whereas RYTHM edged down from #3 to #4 with a 9.8% sales decline; this mix of upward mobility among faster risers and slight slippage from incumbents indicates Cookies’ modest rank recovery is being outpaced by challengers ascending multiple tiers, implying a need to convert recent quarter-on-quarter momentum into sustained share capture to avoid being boxed out of the top 10.
Notable Products
Pomegranate Shake Pre-Roll (1g) posted the steepest movement in September 2026 with a -46.8% month-over-month drop to rank 8, while Blueberry Caviar (3.5g) fell -19.5% to rank 9, signaling pressure on lower-ranked SKUs as the top of the chart consolidated. In contrast, Blue Suede Pre-Roll (1g) rose 27.4% to rank 1 and Ridgeline Lantz (3.5g) climbed 26.0% to rank 3, and five of the top ten are Pre-Roll SKUs, indicating format concentration around quick-consumption items. The dual movement—substantial gains at ranks 1 and 3 alongside double-digit declines at ranks 8 and 9—implies Cookies is concentrating demand into a few hero SKUs while pruning or deprioritizing tail items within the same month.
Top Selling Cannabis Brands






Data for this report comes from real-time sales reporting by participating cannabis retailers via their point-of-sale systems, which are linked up with Headset’s business intelligence software. Headset’s data is very reliable, as it comes digitally direct from our partner retailers. However, the potential does exist for misreporting in the instance of duplicates, incorrectly classified products, inaccurate entry of products into point-of-sale systems, or even simple human error at the point of purchase. Thus, there is a slight margin of error to consider. Brands listed on this page are ranked in the top twenty within the market and product category by total retail sales volume.

